| << Previous | Contents | Next >> |
The FHWA, through the Office of Planning, Environment, and Realty solicited for research and development projects that could lead to transformational changes and revolutionary advances for transportation planning in the United States. This report, Asset Sustainability Index: A Proposed Measure for Long-Term Performance, is a product of that research.
This report examines the use of forward-looking metrics in Australia, Great Britain and in the private sector that measure the sustainability of infrastructure conditions. These metrics encourage a long-term, asset-management-based approach to managing infrastructure, not just to meet condition targets today, but to sustain those targets into the future.
The report also examines the asset management data and systems used in four U.S. States to determine if they could produce long-term sustainability metrics. The report demonstrates that U.S. agencies that have mature asset management systems can produce long-term metrics that provide insight into the future condition of transportation assets. Thus, sustainability metrics such as those used in Australia can be produced in the U.S. using available asset management systems.
The report is intended to provide the transportation community with additional perspectives on performance management as it considers how to integrate accountability, performance, and sustainability into U.S. transportation programs. Most performance measurement systems focus upon current performance. However, the long-term performance of infrastructure is based upon longterm strategies, such as preventive maintenance, which may not significantly increase performance immediately. Adding to the suite of performance metrics some that examine long-term performance can help decision makers understand how today?s actions can influence transportation performance in the next decade. The forward-looking perspective embraces sustainability and allows the current generation of decision makers to understand how their actions will affect a future generation of transportation users.
This report examines the concept of a suite of proposed performance measures centered around an Asset Sustainability Index (ASI). The metrics are proposed to be inherently forward looking and to address a fundamental question surrounding infrastructure management. That is, will current actions result in a financially sustainable highway system? Or, will current actions come at the expense of future stakeholders who will inherit a deteriorated and depreciated highway network?
The metrics are examined primarily for State transportation agency officials but they could be useful to all who manage transportation networks be they at the national, State, regional or local level. Increasingly, these officials are expected to demonstrate they are operating responsibly and transparently. In addition, they face concerns over sustainability. The proposed suite of financial sustainability metrics allow them to add to their performance reporting a set of measures that are forward-looking, leading measures that help predict the future consequences of today?s investment decisions.
Performance measures help to allocate resources, make difficult tradeoffs and to demonstrate accountability. Their use among State transportation agencies is relatively new, having gained prominence in the past decade. Performance measurement in the private sector and in the international transportation sector is more mature, and its lessons hold implications for U.S. transportation officials. A review of the private-sector evolution of performance measures illustrates that over time managers came to increasingly rely upon leading measures, as opposed to backwardlooking or lagging measures. Leading measures illustrate the likely consequences of today?s actions on future conditions. Lagging measures are inherently backward looking and provide only inferences into future results.
Mature performance-measurement frameworks such as the Triple Bottom Line or the Balanced Scorecard often emphasize forward-looking or leading indicators. They use leading indicators to forecast whether today?s actions are likely to achieve the desired results for future stakeholders, or are today?s actions coming at the expense of those future stakeholders?
The financial sustainability metrics in this report build off of similar metrics in Great Britain, Australia and the private sector that measure whether current investment levels will sustain future condition targets. As noted in a Queensland, Australia, sustainability act, "A local government is financially sustainable if the local government is able to maintain its financial capital and infrastructure capital over the long term." The Asset Sustainability Index and its related measures look forward to assess whether the infrastructure investment allows sustainable conditions into the future, preferably for a time horizon of at least 10 years.
Federal, State and local transportation officials repeatedly stress their concern over the condition of their transportation assets and whether they can sustain them at an acceptable condition into the future. Their concerns over future infrastructure sustainability mirror other national areas of concern. The deficits growing in the Federal budget, Social Security and Medicare create serious national debates about the sustainability of these important programs. However, continuing underinvestment in infrastructure also is creating an "infrastructure deficit". If investment is inadequate, current users are consuming infrastructure that they are not replenishing for future generations. Today?s users are, in effect, consuming the infrastructure of their children. This report examines asset sustainability metrics that can illustrate if current users are leaving a legacy for future users, or creating a deficit for them.
This Asset Sustainability Index as proposed in this report is a ratio of the amount budgeted for highway infrastructure preservation divided by the amount needed to adequately sustain infrastructure at a targeted condition over the long term.
| Amount Budgeted Amount Needed |
= Asset Sustainability Index |
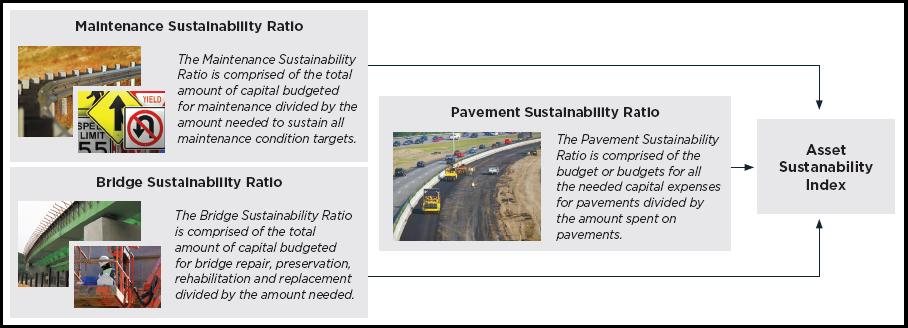
This report examines the proposed index as a composite of three ratios, a Pavement Sustainability Ratio, a Bridge Sustainability Ratio and a Maintenance Sustainability Ratio. When combined, they form an Asset Sustainability Index which is a composite of all three. Aggregated, the Asset Sustainability Index provides at-a-glance summation of critical investment trends. Disaggregated, it allows "drilling down" into system-level or asset-level sustainability.
Figure 1: Ratios from Maintenance, Pavements and Bridges combine into the Asset Sustainability Index.
Although the index and ratios are considered to be simple in concept, the Asset Sustainability Index can be an informative metric useful for long-range plans, short-term State Transportation Improvement Programs or for public budgeting decisions particularly when tracked over time. They boil down complex, long-term infrastructure condition and investment analysis into a suite of easy-to-illustrate metrics. The insight they provide increases with the length of the analysis period.
As this report points out, missing among U.S. transportation practice is a common framework for determining the needed investment to sustain infrastructure at an acceptable condition. The ASI is "Need" divided by "Budget" but there is not a common process for identifying the needed investment for a highway network. To create an analogy, there is no Highway Capacity Manual for infrastructure condition. The Highway Capacity Manual creates a national standard for measuring and setting acceptable levels of highway capacity performance. It defines levels of service as A through F and creates volume-to-capacity ratios for various types of highways. These metrics are universally understood among highway practitioners in the United States and in many nations abroad. The HCM even includes a forecasting component with standards set to ensure adequate levels of service into the future, generally 20 years.
No analogous process exists for universally measuring and forecasting the condition of a highway network and the needed investment to sustain it. The product of such an analysis could be considered to produce a Transportation Asset Management Plan that indicates what comprehensive series of investments are necessary to sustain asset conditions for a forecasted period, say 10 or 20 years. If such a plan were based on Transportation Asset Management principles, it would be policy driven and include a comprehensive mix of treatments to ensure the lowest lifecycle costs for the various highway assets. Throughout this report, case studies illustrate that sustainability metrics can be generated in the United States. However, in each case study, no actual Transportation Asset Management plan exists. Instead, the analysis "teases out" from the mature asset management practices of the examined States how their asset management practices produce credible estimates of "need" that resemble what a mature Transportation Asset Management Plan would include.
This report also borrows from the private sector. The ASI and its components are analogous to the capital-investment metrics financial analysts use to evaluate the long-term health of capitalintensive companies such as manufacturers, railroads or electric utilities. If capital-intensive industries fail to adequately invest in their own capital assets, they are considered by analysts to be poor long-term investments. In effect, current owners are consuming the physical assets that future shareholders need.
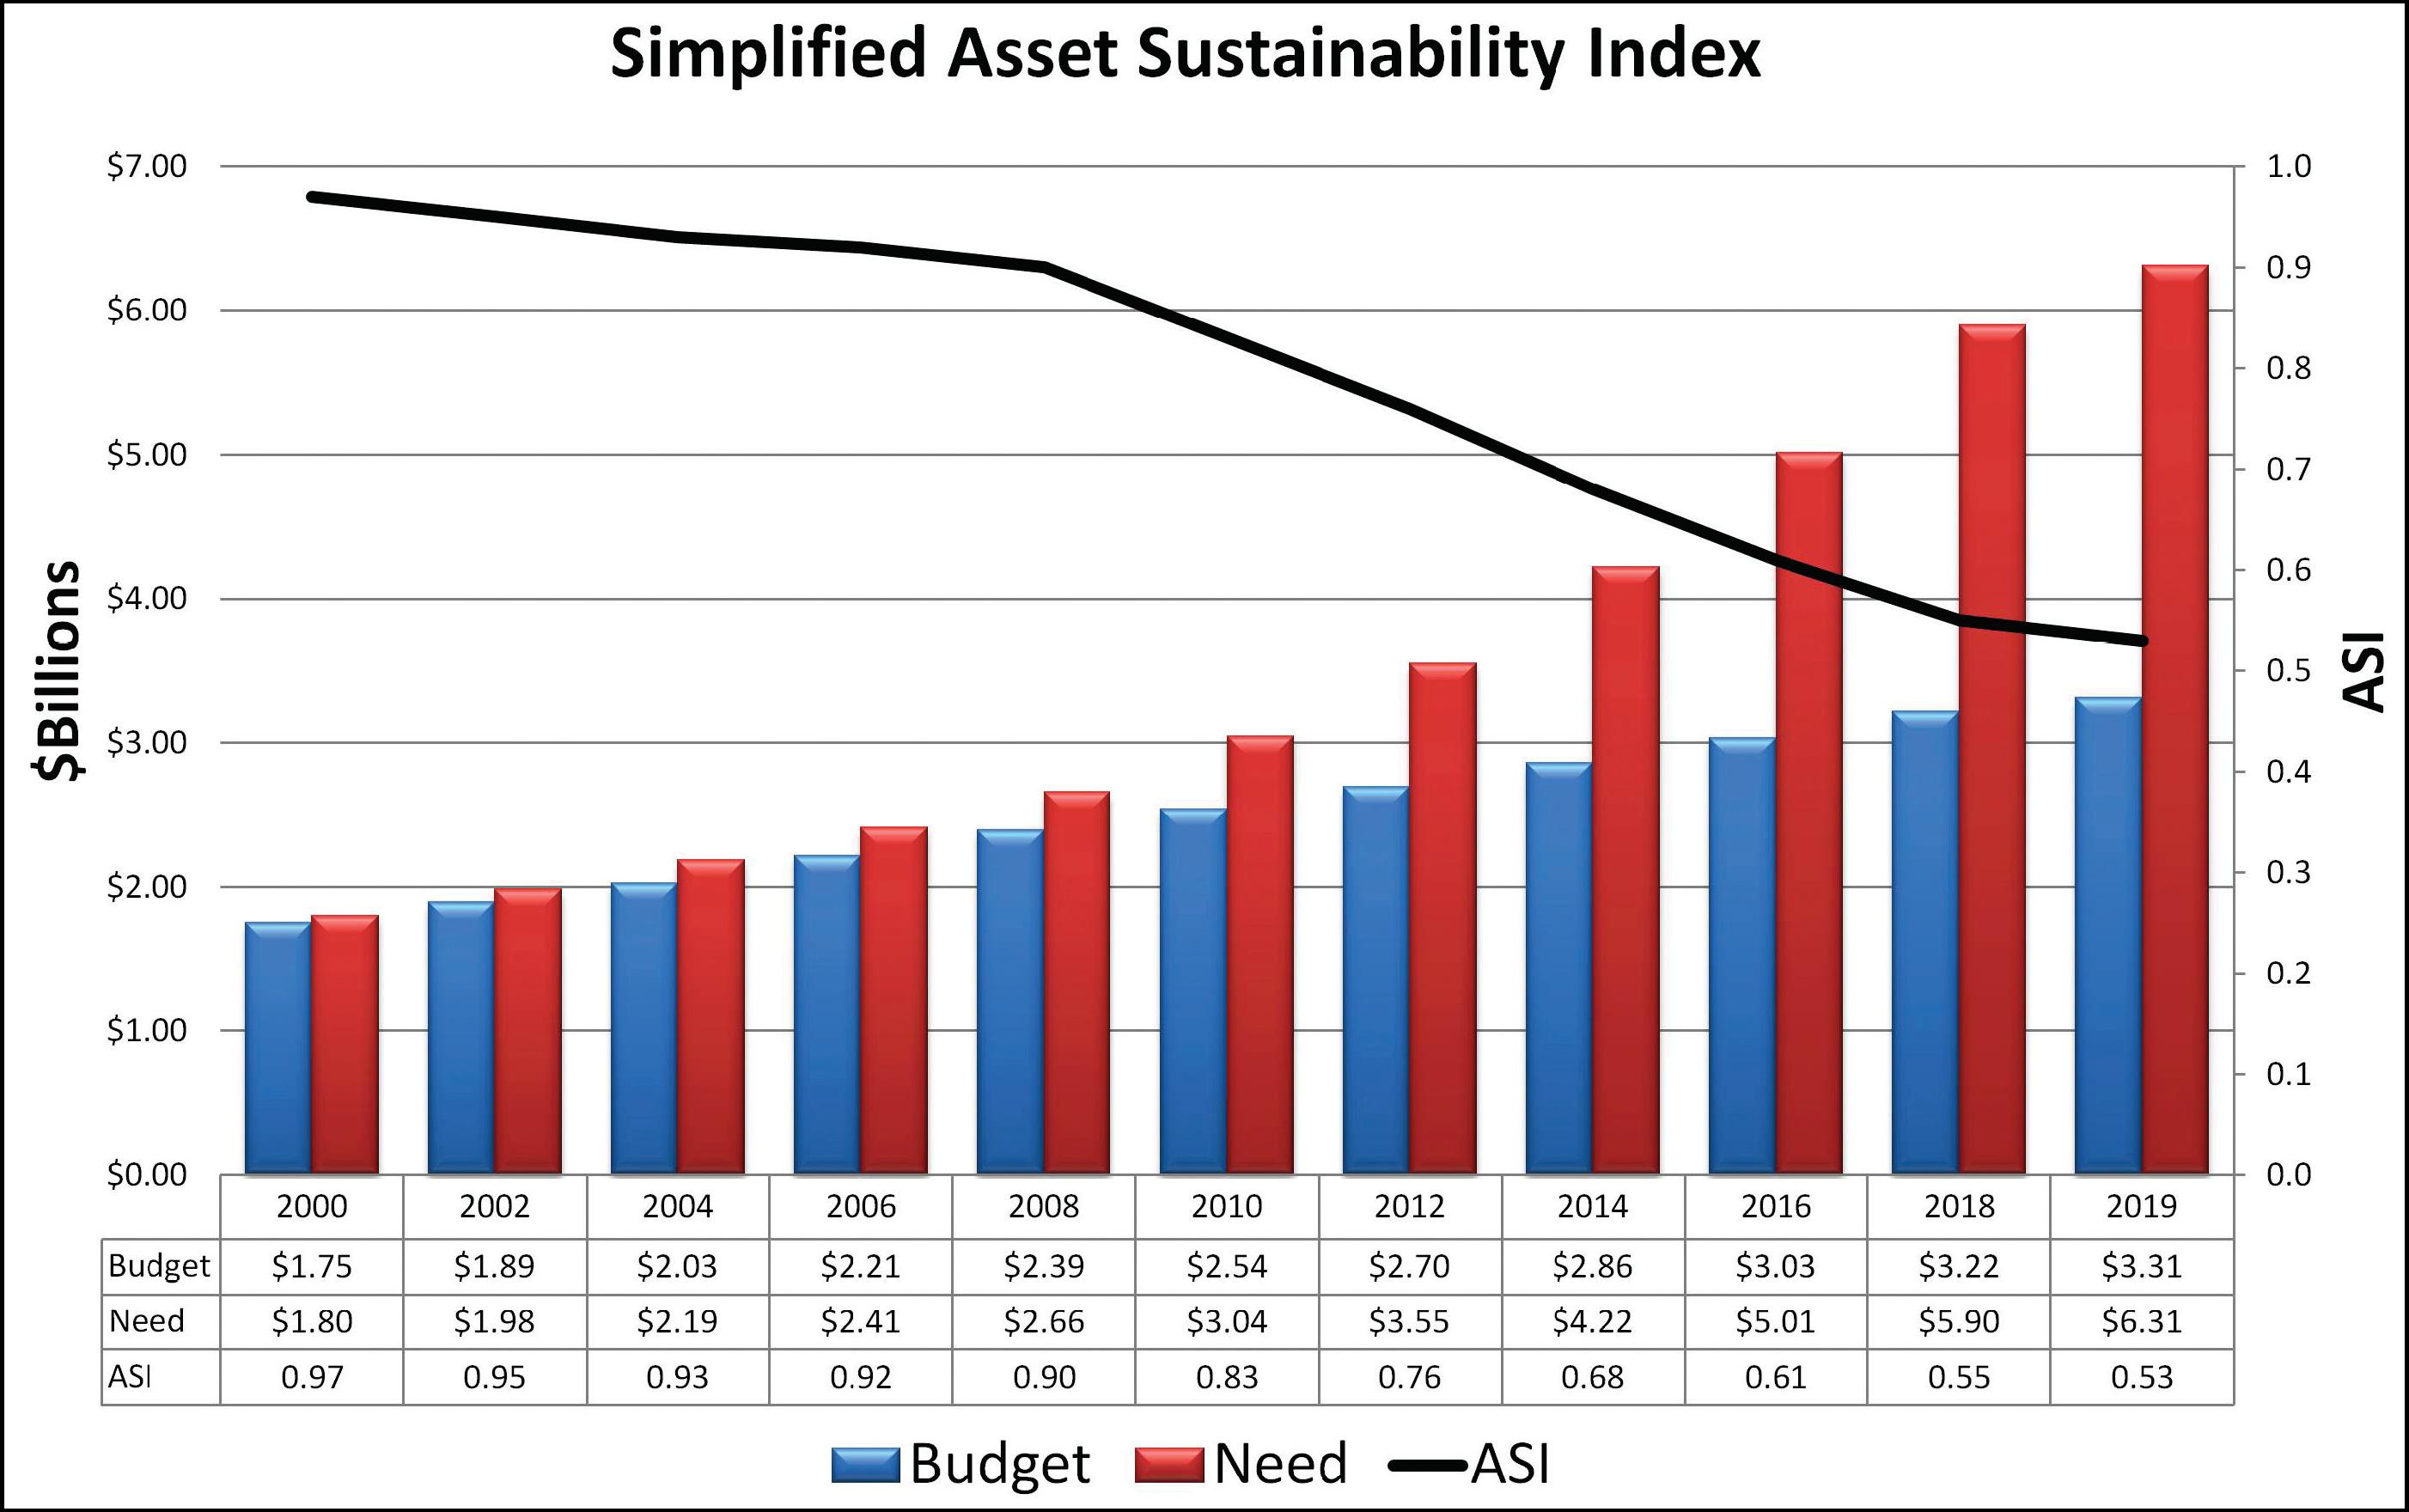
Building from international examples, the ASI emulates recent practices in Great Britain and Australia in which State and local governments are required to report on the long-term financial sustainability of their infrastructure. State and local governments are required to demonstrate they are not under-investing in infrastructure and creating future unfunded maintenance and repair needs, such as illustrated in Figure 2 (see page 4). Figure 2 illustrates that levels budgeted for sustaining highway infrastructure conditions were near needed levels in this example in the early 2000s but began to decline relative to need. As assets aged, their condition deteriorated at a more rapid rate, needed investments rose and the relatively modest budget increases consistently fell behind the needed investment. The Asset Sustainability Index fell over 20 years from a high of .97 to .53. In other words, in this forecast by 2019 if these trends continue only 53 percent of the investment needed to sustain highway infrastructure conditions will be budgeted. In Figure 2, the mid-point of the 20-year trend is highlighted to illustrate for policy makers the past trends and likely future consequences of the current forecasts.
Figure 2: This illustration depicts how the use of the ASI in a time series represents an important decline in needed infrastructure investment.
Generating the Asset Sustainability Index relies on two credible forecasts. One is for the amount of needed investment, preferably developed from a credible Transportation Asset Management (TAM) analysis. The second element is a longterm fiscal forecast. Although complex, these two analyses are produced by capital-intensive private-sector corporations and are being developed by State and local governments in Australia and on an ad hoc basis by the U.S. agencies examined in this report.
This report describes the ASI and examines whether it can be produced using typically available U.S. highway data.
The report also explores a complementary set of metrics, those related to "Asset Valuation". Asset valuation is defined as the calculated monetary value of an asset or class of assets. By tracking over the long-term whether a transportation agency?s assets are increasing or declining in value, the effect of investment also can be displayed. If asset values decline, society is losing its highway equity and not replenishing that equity for future users. In Australia, Great Britain and in the private sector Asset Valuation serves as a complementary metric to those such as the Asset Sustainability Index. They seek to determine whether current actions increase or decrease "public equity".
The report is organized in the following manner:
| << Previous | Contents | Next >> |