| << Previous | Contents | Next >> |
The preceding sections describe the Asset Sustainability Index and illustrate its precedents in the private sector. The following section describes several international examples of precedents for an ASI. It examines in particular how in Australia a very similar Asset Sustainability Ratio was implemented in 2010.
The three Australian States of Queensland, Victoria and New South Wales have been known for more than a decade for their TAM practices. Those practices gradually expanded to include elements of long-term financial sustainability. While the concept of long-term financial sustainability is not widely discussed in the United States, it is in Australian government circles. Former Australian Prime Minister Kevin Rudd in a 2008 address to the newly formed Australian Council of Local Governments (ACLG) urged a discussion about infrastructure needs that was based upon long-term asset management plans developed in concert with long-term financial sustainability plans.[1] The Prime Minister indicated that such a discussion was not possible at that time because of inconsistent financial reporting processes among the local governments. National guidelines for such reporting would enhance national understanding of infrastructure needs by:
Several of the typical statutes, accounting standards and reports that illustrate the evolving concepts of asset sustainability reporting in Australia are summarized below. These references are not exhaustive, but rather illustrative, of the evolving Australian practices.
The Queensland (Australia) Local Government Act of 2009 advances earlier State-required infrastructure reporting statutes to include reports of whether local governments are investing sufficient amounts in infrastructure to ensure their financial sustainability for future generations. As the Act says in Part 3 Section 101:
The State statute requires that the local governments develop a 10-year financial forecast that complements a 10-year asset management plan. The agencies? budgets and financial plans must include reports of capital expenditures and whether they balance with asset depreciation charges. The decline or change in asset conditions is to be reported on balance sheets and compared against the levels of infrastructure investment. Such reporting provides transparency as to the long-term sustainability of each government?s assets, including highway assets. Also, an annual report as to the implementation of the plans is required.
The Queensland Department of Local Government and Planning?s implementation guidelines stress that the State now considers long-term sustainability of assets to be an important component of determining the health of governments.[2]
"The existence of asset management plans for key infrastructure assets is a necessary predecessor to local governments having a comprehensive long-term financial plan that supports planning and decision-making processes," it states. "This long-term planning for the infrastructure assets allows councils to understand the future financial commitments, and to develop strategies that address key strategic issues such as the local government?s approach to service provision and service levels, its debt borrowing policy and revenue policy-including its rating methodology. A local government needs to clearly understand what its future commitments are in order to prepare budgets properly."
It notes that the emphasis of the Local Government Act is to shift financial planning and discussion from the short term to the long term. "The long-term financial forecasts rely on a clear perspective of the long-term infrastructure funding needs of the local government, including maintenance, operations and infrastructure renewals. Without this, a longterm financial forecast for a local government is indicative at best."
The guidelines go on to say that the concept of asset sustainability is still emerging but that the 2009 statute puts in place processes to make it a standard part of the State's governance of infrastructure planning. Inherent in the process of sustainability is the need to develop meaningful, goal-driven asset management plans. The guidelines go on to say:
"Local governments should look to ensure that:
Financial sustainability is about local governments being able to maintain their infrastructure capital and financial capital over the long-term. ... The essence of the new Local Government Act 2009 is achieving financial sustainability and improving planning in the long-term."
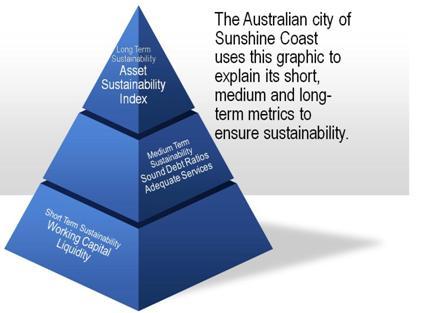
Figure 13: Sunshine Coast short-term, medium-term and long-term metrics.
As noted in the second bullet above, the development of long-term financial infrastructure indicators is a work in progress. As the act was only implemented in 2009, not all governments have refined the required reports. Of those that did, not all were completed in comparable ways that allow cross-jurisdiction comparisons.[3] However, the implementation of the 2009 act has begun the process of measuring the long-term fiscal sustainability of infrastructure assets in Queensland and some early examples of these reports are listed below.
In its first annual report after enactment of the 2009 Act, the Queensland Department of Infrastructure and Planning published an analysis of the local governments? assessment of their overall sustainability, including for highway infrastructure. As a work in progress, the department noted that long-term highway and other forecasts were largely "indicative" and not definitive because of a lack of consistency and completeness in the asset management plans of agencies, particularly smaller ones. The first year assessment indicated that most local governments were able to prepare long-term financial forecasts and develop financial strategies. However, the asset management plans were not fully sufficient to link them to the financial strategies.
The local governments were investing significant sums into infrastructure renewal and preservation but most were predicting a decline in such investments in the later years of the 2009-2019 period. The Department of Infrastructure and Planning said it was not yet possible to determine that all the local governments are sustainable because of the lack of adequate asset management plans. It would consider a local government to be sustainable if it:
The lack of complete, long-term asset management plans was the most common hurdle yet to be overcome. The Department noted that the emphasis is to be on maintaining service capacity of assets into the long-term and that there is a significant difference between measuring current infrastructure conditions and ensuring their long-term performance. The assessment of current conditions provides a "point in time" indicator but that the future assurance of infrastructure adequacy is dependent upon a sound long-term asset management plan tied credibly to a long-term financial plan.
The Queensland framework allows for analysis of a number of indicators of a community?s health. The analytics are similar to those that a stock analyst would review for a publicly traded company to assess the company?s worthiness as an investment candidate. The Queensland analysis looks at issues such as the community?s financial reserves, its working capital and its debt-coverage ratios.
Similar metrics are applied to the infrastructure, among them:
The Asset Sustainability Ratio is defined in Queensland as the capital expenditure on the replacement of assets (renewals) divided by depreciation expense.
| Capital Expenses on Renewal of Assets Depreciation of Assets |
It is expressed as a percentage. It is an approximation of the extent to which the infrastructure assets managed by the local government are being replaced as they reach the end of their useful lives. The depreciation expense represents an estimate of the extent to which the infrastructure assets have been consumed in a period. Capital expenditure on renewals (replacing assets that the government already has) is an indicator of the extent to which the infrastructure assets are being replaced as they reach the end of their useful life.
The Asset Consumption Ratio is the value of infrastructure assets divided by gross current replacement cost of infrastructure assets.
| Current Value of Assets Replacement Cost of Assets |
It is expressed as a percentage. This ratio shows the current value of a government?s depreciable assets relative to their "as new value" in current prices. This ratio seeks to highlight the aged condition of the stock of physical assets.
The Asset Renewal Funding Ratio is the net present value of the planned capital expenditures on renewals over 10 years divided by the net present value of the required capital expenditures on renewals over the same period.
| NPV of Capital Invested Over 10 Years Needed Investment to Sustain Assets |
It is expressed as a percent and it represents the extent to which the required capital expenditures on renewals per the asset management plans have been incorporated into the 10-year financial model of the local government.
| 2009-10 | 2018-19 | Average (10 yr) | Difference (10-yr) | |
|---|---|---|---|---|
| Asset Sustainability Ratio | 166.5% | 98.0% | 115.3% | -68.5% |
| Asset Consumption Ratio | 74.3% | 70.5% | 73.1% | -3.9% |
This initial year?s analysis indicates that for the 49 local governments reporting that for the early years of the first forecast period they appear to be investing sufficient sums in infrastructure to offset the depreciation, or deterioration, expected. The sums reported in Table 9 are for all infrastructure including highways, buildings, water supplies, drainage systems and retaining walls. For roads and transport networks the reports indicate the 2009/2010 investment in "renewals" were $908 million ($AUS) compared to depreciation of $621 million ($AUS). An additional $1 billion was invested in new or upgraded roadways. Superficially, those numbers indicate that sufficient amounts are invested to offset depreciation. Although initially promising, the Department of Infrastructure and Local Government reports several caveats of concern. First, is that the asset management plans were not adequate to determine if the current level of investment will be sufficient to address future deterioration. Second, the amount of new construction appears to be unsustainable and will lead to new roadways that will require higher levels of future maintenance. Third, the future year forecasts indicate declining levels of investment in renewals that could indicate that current levels of renewal investment cannot be sustained. As noted, the Asset Sustainability Ratio falls from a high of 1.66 to .98. That equates to current expenditures being 66 percent higher than necessary to counteract depreciation while future expenditures fall to only .98 percent of necessary amounts in the 2018/19 period. The report stresses that one-year?s funding, such as 2018/19, should not be considered indicative of a long-term trend. However, the declining levels of investment, combined with the high level of new construction and the inadequacy of the asset management plans caused the Department to caution that long-term infrastructure sustainability is not assured in Queensland.
Two of the larger cities in Queensland published draft or final community financial plans that include these new asset indicators. The new reports provide long-term insight into the expected infrastructure investment levels and how those levels will contribute to long-term asset conditions. The cities have completed, or are drafting, the long-term fiscal sustainability plans as well as their long-term asset management plans. The updates to city councils and to the public indicate that the exercises require them to focus upon their rates of asset depreciation and deterioration and to consider whether they have the financial capacity to offset the expected deterioration. For instance, the city of Sunshine Coast notes in its draft Financial Sustainability Plan 2010 to 2020 that it is not presently meeting its asset sustainability ratio targets but through long-term budgeting it is planning to achieve them starting in 2015. Table 10 from the Sunshine Coast City Council Draft Financial Sustainability Plan illustrates its use of these new metrics. Its short-term metrics such as Cash Liquidity reflect the city?s short-term financial health, while long-term, it is now relying on the asset-investment indicators to improve its long-term perspective.
Below in Table 10, it reports its first estimation of its long-term asset indicators, as well as other indicators of long-term financial health. As can be seen, its initial forecast for its Asset Sustainability Ratio ranges from 76 percent to 60 percent, while its target is 90 percent. In its narrative, it notes this performance will require attention and that the city hopes in future budgets beginning in 2015 to increase its infrastructure renewal investment to meet the 90 percent target.
| Target | Actual 2010-11 | Estimate 2011-12 | Estimate 2012-13 | Estimate 2013-14 | Estimate 2014-15 | Estimate 2015-16 | Estimate 2016-17 | Estimate 2017-18 | Estimate 2018-19 | Estimate 2019-20 | Estimate 2020-21 | |
|---|---|---|---|---|---|---|---|---|---|---|---|---|
| Operating Surplus Ratio | 0-15% | 0.1% | 0.1% | 0.0% | 0.3% | 0.9% | 0.8% | 0.2% | 0.1% | 0.0% | 0.1% | 0.3% |
| Net Financial Liabilities Ratio | <60% | 18.2% | 21.0% | 25.0% | 26.0% | 23.0% | 25.0% | 27.0% | 27.0% | 28.0% | 28.0% | 31.0% |
| Interest Coverage Ratio | 0-10% | 2.9% | (8.7%) | (8.1%) | (7.7%) | (7.5%) | (7.3%) | (7.0%) | (6.7%) | (6.5%) | (6.4%) | (6.2%) |
| Asset Sustainability Ratio | >90% | 76% | 77% | 66% | 69% | 61% | 61% | 61% | 60% | 60% | 60% | 60% |
| Asset Consumption Ratio | 40-80% | 63% | 78% | 78% | 77% | 77% | 76% | 76% | 75% | 75% | 74% | 74% |
| Debt to Assets Ratio | <10% | 5.2% | 4.2% | 4.1% | 4.0% | 3.8% | 3.9% | 4.0% | 3.9% | 3.8% | 3.8% | 3.7% |
| Cash Balance (Months) | 6.0 | 6.0 | 6.9 | 5.9 | 4.9 | 4.7 | 4.6 | 4.3 | 3.9 | 3.5 | 3.1 | 2.6 |
The advancement in public reporting represented by these statements are several. First, they are intended to be much clearer to an average person than would be traditional accounting or engineering reports. Although they are expressed in somewhat technical terms, the reports come with glossaries and definitions to explain their meaning to a lay person. For instance, in Table 10, the Operating Surplus Ratio measures the available cash once operating expenses are met. As seen, the city has currently, and expects to have in the future, little in the way of excess cash beyond what is needed for currently identified costs. However, its debt ratios are reasonable and its net financial liabilities are well below its target. These indicate that it could increase borrowing in the future. The Asset Consumption Ratio indicates that depreciation will be expected to outpace investment. The Asset Sustainability Ratio shows that with current long-term planned expenditures that its investment in asset renewal could fall to as much as 30 percent below target levels. However, the city has a very high target of 90 percent. That target means, in effect, it wants 90 percent of infrastructure to have almost "as new" value. Second, these reports provide a long-term perspective missing from most financial reports. Generally, financial reports cover two budget years and do not provide insight into the adequacy of long-term infrastructure investment. Third, these financial reports illustrate specifically the forecast for long-term infrastructure conditions. Typical financial reports may indicate short-term budgets for infrastructure but do not address whether those budgets were adequate for long-term sustainability of asset conditions.
The Queensland Bundaberg Regional Council reports the following in its fiscal plan as seen in Table 11.
| Target | Actual 2009-10 | Estimate 2010-11 | Estimate 2011-12 | Estimate 2012-13 | Estimate 2013-14 | Estimate 2014-15 | Estimate 2015-16 | Estimate 2016-17 | Estimate 2017-18 | Estimate 2018-19 | Estimate 2019-20 | |
|---|---|---|---|---|---|---|---|---|---|---|---|---|
| Asset Consumption Ratio | 40-80% | 79% | 78% | 77% | 77% | 76% | 76% | 75% | 75% | 74% | 74% | 73% |
| Asset Sustainability Ratio | >90% | 130% | 163% | 163% | 145% | 164% | 128% | 117% | 117% | 117% | 113% | 136% |
The Asset Consumption Ratio basically indicates the current, depreciated value of the infrastructure compared to its new, as built cost. So in effect, the city is spending enough over time to keep the infrastructure, in effect, at between 79 percent and 73 percent of its "as new" condition.
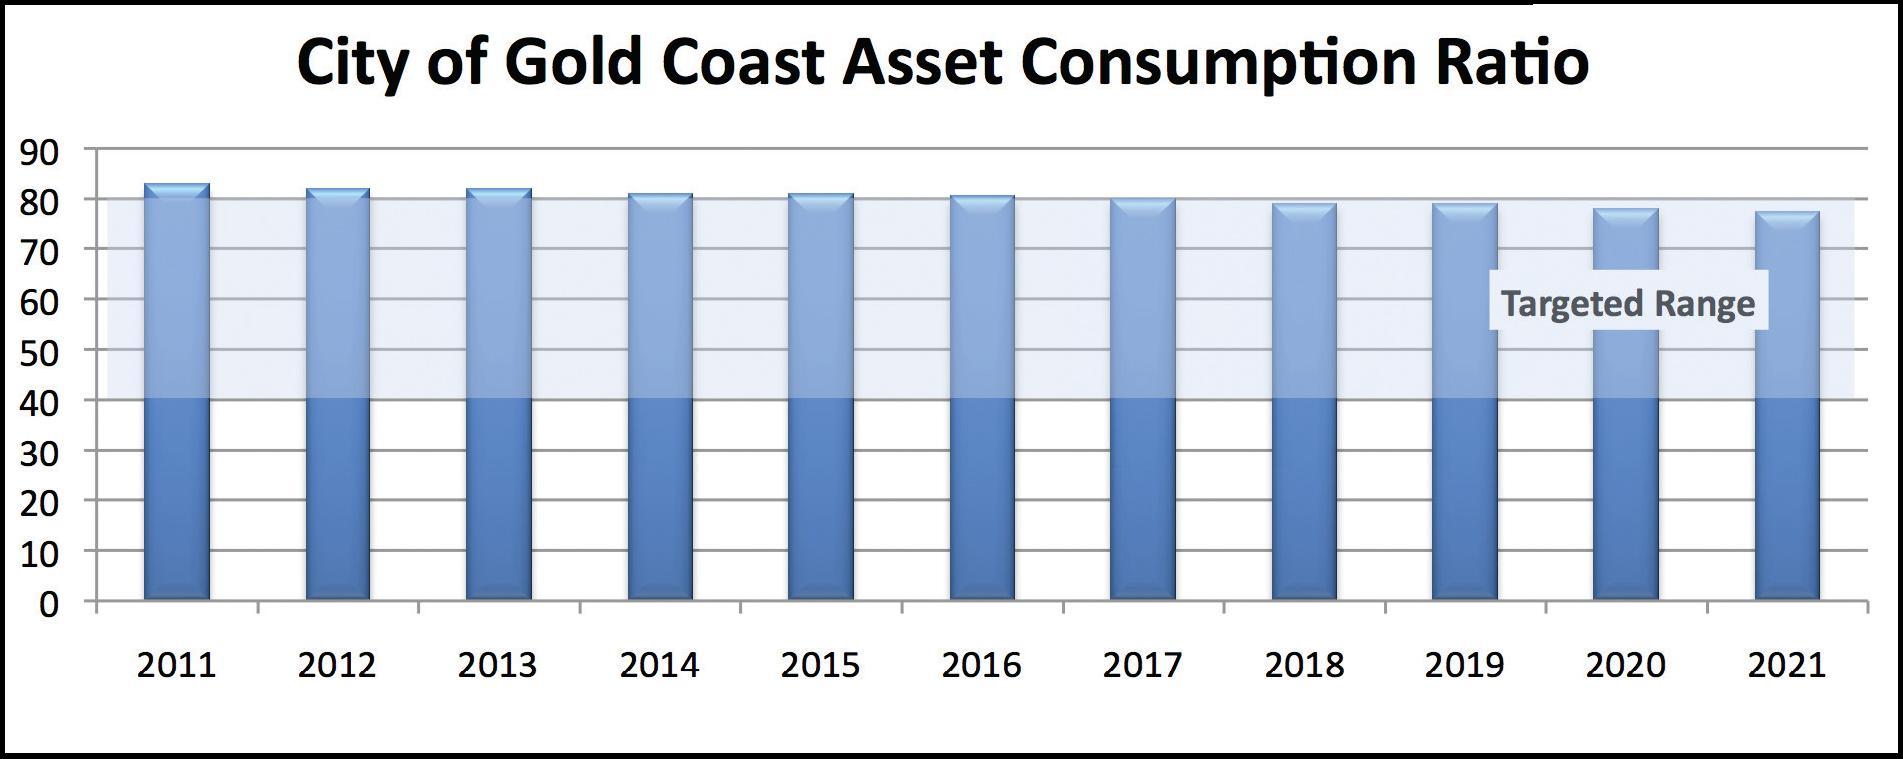
In Figure 14, the City of the Gold Coast depicts its Asset Consumption Ratio in a slightly different format. Again, however, the city is indicating that its long-term infrastructure investment levels appear to be adequate although it is expecting a steady decline in its Asset Consumption performance but within targeted levels.
Figure 14: Gold Coast Asset Consumption forecasts.
The Transportation Asset Management (TAM) practices in Australia and New Zealand in the past decade also have evolved to embrace what the Australians call "asset valuation". It is the subset of asset management and auditing practices that captures the long-term depreciated value of infrastructure assets, such as highways. Asset valuation has now become a standard part of the Australian and New Zealand State highway TAM processes. Those practices have been in place longer than they have been for the local governments in Queensland but they still continue to be an evolving work in progress for the State highway agencies.
The Austroads Guide to Asset Management includes a Chapter 8 on Asset Valuation and Audit. Austroads is the association of State and territorial transportation agencies in Australia and the national transportation agency in New Zealand. It is similar to the American Association of State Highway and Transportation Officials (AASHTO) in the United States. It helps set national standards, facilitates peer interaction and conducts research on emerging issues.
Austroads published the Asset Valuation chapter, which is intended to complement national and State efforts to refine the valuation process among the State and territorial highway agencies. It complements also the Australian Infrastructure Financial Management Guidelines published by the Institute of Public Works Engineering Australia (IPWEA) and the standards of the Australian Accounting Standards Board (AASB).
In concept and practice, the Chapter 8 Asset Valuation and Audit guidelines are similar to the concepts and practices described in the Queensland Local Government Act. Because of the similarities, the details of the Austroads asset valuation guidelines will not be restated. However, the key additional concepts are added here.
Austroads notes that "sustainability" has evolved a new meaning in recent years to embrace environmental, social and economic prosperity, or a Triple Bottom Line. The 20-year focus of both asset management plans and infrastructure financial plans are intended to ensure that public agencies today do not consume the benefits necessary to sustain future generations. These benefits extend to the economic benefits or economic value of highway infrastructure. Sustainability only is achieved if the infrastructure is managed today to ensure that extraordinary expenditures are not necessary in the future to provide future users the economic benefits of a sound transportation system. In effect, investing adequately today to protect the needs of future users is the essence of infrastructure sustainability.
"If the Agency?s long-term finances are sustainable, then disruptive tax increases or spending cuts can be avoided, the taxation burden will be fairly shared between current and future taxpayers and the stability or predictability of government taxes and charges will not be at risk," the guidelines notes.[4]
The guidelines also reflect another evolution, that of transparency to lay readers of financial documents. The guidelines note that agencies should produce financial reports so that they are understandable to readers with only a general understanding of business, economics or accounting. Also, the information should be relevant for decision making. In particular, it should be comparable so that trends over time or trends with other agencies can be compared. In short, the financial documents are intended to evolve and to serve a broad public analysis and budgeting function, rather than a strictly perfunctory administrative requirement.
Two of the essential concepts are the capturing of "useful life" and "economic life" of assets. Presently, data bases such as the U.S. National Bridge Inventory report on the number, size and condition of bridges. From the conditions of the bridge some inference into the "useful life" or the "economic life" of the bridges can be made. Bridges with a structural deficiency rating of a 3 or a 4 clearly would have shorter useful or economic lives than a bridge rated a 9. The Austroads guidelines and other Australian asset valuation efforts seek to quantify and summarize the useful and economic life in a clear fashion. In short, if a new bridge at a given location would be valued at $1 million but the existing bridge at that location is deteriorated and only valued at $100,000, then clearly the existing bridge has less value to the public than a new bridge. If proper repair and maintenance that costs $200,000 can make the bridge function like a newer bridge, then the investment clearly increases the value of the public?s assets. Using proper maintenance and repair to leave future generations with a higher-valued set of assets is among the key objectives of the asset valuation process.
The useful life is defined as the period over which the asset is expected to provide services. The economic life is the period until the asset ceases to be the lowest-cost alternative to meet the required level of service. An example would be a pavement that has severely deteriorated so that it no longer provides an acceptable ride. If the pavement is so deteriorated that resurfacings and other less-complex treatments cannot restore its level of service for an acceptable period, it has an economic life of zero. The pavement still exists but its condition is so poor that only an essentially new pavement could provide an adequate level of service for an acceptable cost.
A similar metric that the financial reporting guidelines describe is that of "impairment ". An asset is impaired when its reported value is less than the benefits recovered by the use or sale of the asset. Assets become impaired when they are physically damaged or obsolete.
As with the Queensland guidelines, the Austroads guidelines spend considerable effort describing depreciation of assets. Once the full depreciation of an asset is documented, the value of the agency?s assets can be compared to its liabilities and the overall financial health of the organization can be determined. A simple test in the private sector of a business?s health is to divide its non-current assets by its non-current liabilities, such as dividing the value of its physical plant by its long-term debts such as bonds.
Although couched in financial terms, the guidelines are intended to provide insight into important public policy and public budgeting concerns. These financial ratios are actually performance measures that can be used to judge the health of the infrastructure, the performance of the agency and the performance of the overall government?s maintenance of its infrastructure. The "end game" of the Austroads financial guidelines is to allow the measurement of individual assets, the measurement of the agencies that manage the assets and the measurement of the overall government?s long-term approach to managing its entire network of assets.
The various financial metrics can be boiled down to several key ones similar to those used in Queensland. These include:
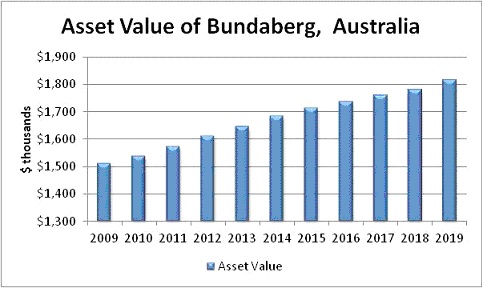
Figure 15 illustrates the actual 2009 and 2010 asset values for Bundaberg, Australia, with forecasts through 2019. This asset valuation analysis is intended to indicate whether the infrastructure investment practices increase or decrease the community?s infrastructure "equity".
Figure 15: Asset values in Bundaberg.
Since the mid-2000s, the United Kingdom and its local governments have refined their roadway asset valuation processes, with some similarities and differences from the Australian practices. Like with the Queensland example, the UK examples hold relevance for the United States in that the central agencies have developed guidance attempting to standardize asset valuation among many different governments. The intent is to allow benchmarking and comparability, much as is being discussed in the United States. The UK has many similarities to the U.S. governance structure. Obviously, both are industrialized democracies but beyond that the UK has a central government that works as both a "coach" and an "umpire" for many local governments in carrying out central policy. In addition, Scotland, Wales and Northern Ireland have considerable autonomy. Therefore, the English Department for Transport (DfT) sets policy for English highways but not necessarily for Scottish, Welsh or Northern Ireland highways. However, the local governments across Scotland, Wales and England have cooperated on some voluntary asset valuation standards, such as the Guidance Document for Highway Infrastructure Asset Valuation produced by the County Surveyors Society/TAG Asset Management Working Group in 2005. That organization has since changed its name to ADEPT, the Association of Directors of the Environment, Economy, Planning and Transport. The local government benchmarking and cooperation is similar to what occurs between U.S. States through AASHTO.
As in Queensland and as with the U.S. GASB 34 requirements, the British valuation guidance for local governments emphasizes that asset valuation is about accountability and transparency in support of sound infrastructure policy. It says in part:
"A fundamental component of long term planning is to ensure the asset base is preserved and replenished in a sustainable way without imposing an undue financial burden on future generations. The preservation of the asset base can be measured and monitored over time using a robust asset valuation procedure that provides a true and fair value of the assets."[5]
It defines asset valuation as the calculation in terms of monetary value of a government?s physical assets. It allows the estimating of the "consumption" of a society?s physical assets over time and compares that consumption with the renewal and replacement of assets. It notes that the main drivers for asset valuation are:
The guidance notes that the mere assigning of monetary value to highway assets casts them as an important public asset worthy of preservation. The long-term reporting of the value of the public?s assets is an important mechanism for demonstrating stewardship. Monitoring how the value of highway infrastructure is rising or falling indicates if costs are being unduly passed on to future generations. It also provides compelling arguments for sound asset management and sufficient investment. As such, the asset valuation process can produce important metrics that support Performance Management and other forms of public accountability.
By reporting upon changes in asset valuation, overall depreciation and the improvement or impairment of assets over time, the agency can discern if its maintenance practices and investment levels are sufficient to sustain the assets at targeted levels. Analyzing the reasons for assets? decline can lead to improved maintenance practices, improved asset treatments or improved investment levels.
"These programs of work influence the asset value, i.e. the work program may maintain or increase the asset value or, if it is not adequate, then the asset value may decrease. Monitoring asset value over time can therefore be used to demonstrate stewardship of assets. This information provides an important input to a business case for investing in the maintenance and upkeep of public assets."
The British guidance notes that asset valuation does not succeed independently but is part of a suite of sound practices that an agency should incorporate including:
In addition, it says tests of the adequacy of the asset valuation process should be that it is reliable, comparable and material. That it is should be free of bias, comparable to analyses of past years or with other agencies and that it focus upon the material issues important to decision makers.
As with the Queensland and GASB processes, key factors in asset valuation include the tracking of depreciation, which is defined as the systematic consumption of economic benefits. The benefits inherent in the asset are consumed through use, age, deterioration or obsolescence. Impairment is the reduction in asset value due to a sudden or expected decrease in condition, such as damage caused by flooding or landslide.
As a method of supporting decision making, ensuring accountability and measuring effectiveness, the guidance recommends three major performance measures. Again, they are similar to the Queensland measures but illustrate different nuances of measurement that provide different insights into performance than those used in Queensland.
The three key measures are:
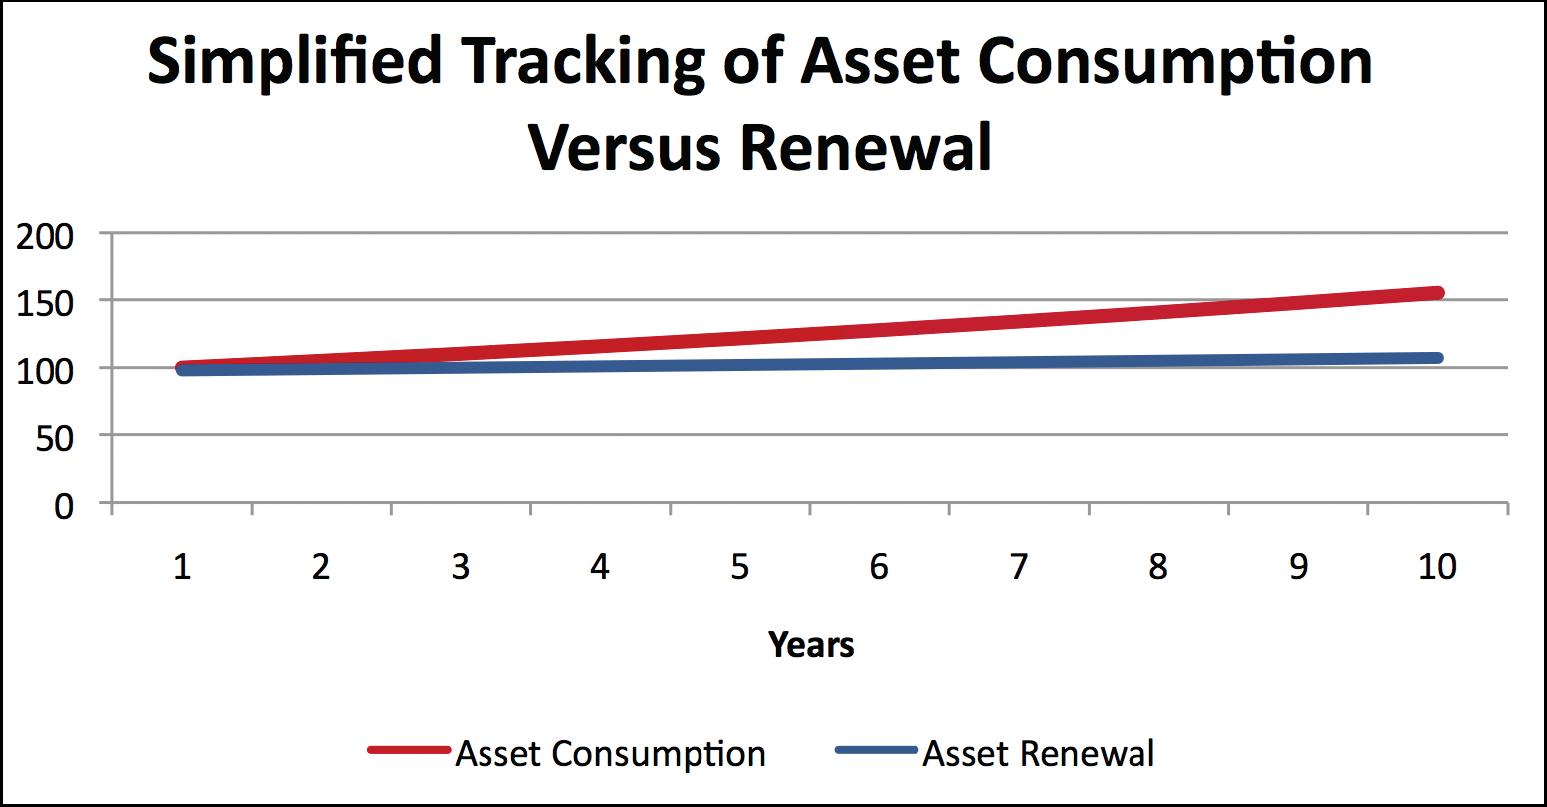
Figure 16 represents an idealized Asset Consumption indicator described in the British guidance. It indicates that over 10 years, the rate of asset consumption or deterioration is outpacing the rate of asset renewal. The overall value of the agency's assets is declining and future users will incur higher costs to restore conditions to the level of year 1. In effect, current users are consuming the assets that future users will need.
Figure 16: An idealized example of asset consumption.
[1] Queensland Department of Local Government and Planning, Financial Management (Sustainability) Guideline, 2011, pg. 20.
[2] Queensland Department of Local Government.
[3] Queensland Department of Infrastructure and Planning, "Report on the Annual return on financial management (sustainability) 2009", accessed at http://www.dlgp.qld.gov.au/resources/guideline/sustainability/financial-management.pdf on March 14, 2011.
[4] Austroads, "Guide to Asset Management Park 8: Asset Valuation and Audit", pg. 2.
[5] County Surveyors Society/TAG Asset Management Working Group", 2005 Edition, pg.4.
| << Previous | Contents | Next >> |