| << Previous | Contents | Next >> |
The Asset Sustainability Index and its related ratios are considered in this report as evolutionary next steps to further enhance the reporting of transportation asset management needs and issues. The practice of TAM has steadily evolved from the mid-1990s in the United States and has at several points of its development intersected with other important reporting frameworks. One such intersection is with the Governmental Accounting Standards Board Statement 34 (GASB 34). GASB 34 went into effect in 2001 and represented a major change in government accounting for infrastructure.
The Asset Sustainability Ratio represents a complementary mirror image of the GASB 34 reporting process. While the ASI is forward looking, the GASB34 reports are backward looking. They report upon past changes in highway asset values, conditions and expenditures. If the two were reported in a coordinated fashion, they could provide a long-term perspective on where infrastructure conditions have been and where they are heading. The GASB reports would provide a 10-year summary of changes in asset values and expenditures while the ASI forecasts would provide a similar projection into the future.
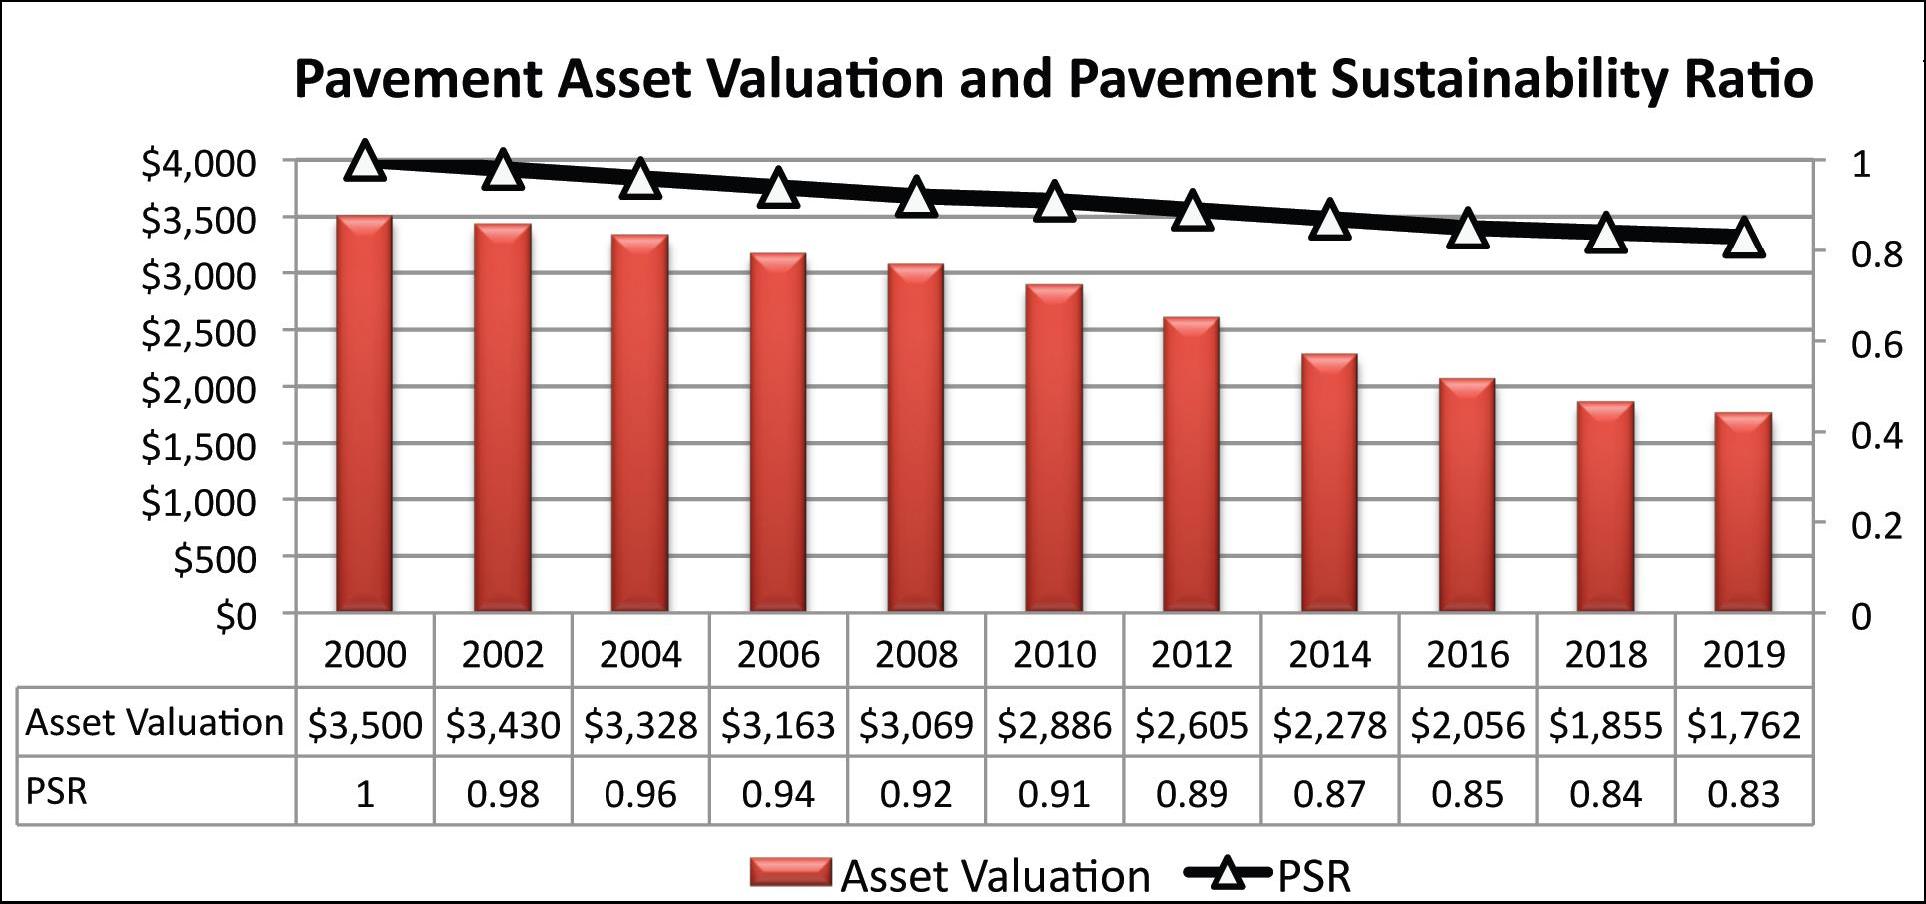
Figure 69: Theoretical Pavement Sustainability Ratio and corresponding asset valuation.
Figure 69 is repeated from Chapter 1 to illustrate the long-term perspective that could be provided by combining GASB 34 reports of past trends with ASI forecasts of likely future conditions. As seen in Figure 69, the Asset Valuation of the theoretical rural pavement network is shown as having declined from 2000 to the present. This is the type of information that can be produced from the lagging GASB 34 reports. Looking forward from 2011 to 2019, the forecast illustrates that the decline in asset value is expected to increase and that the level of necessary investment has fallen from nearly 100 percent to a low of 83 percent, or a Pavement Sustainability Ratio of .83. Commensurately, the value of the rural pavement network has declined from $3.5 billion to only $1.76 billion. In other words, this theoretical State has lost half of the value of its rural highway network pavements.
Currently, the GASB 34 reports don't provide this type of granular insight for individual asset classes, such as rural pavements, for reasons that are discussed below. However, the evolution of the sustainability ratios could provide an evolutionary next step to further enhance the value of the existing GASB 34 processes.
The GASB 34 standards were intended when adopted in 1999 to provide new insights into whether U.S. public agencies were accruing future liabilities in the form of deteriorated assets. Among the objectives of GASB 34 was to improve public decision making by treating long-term capital assets such as highways as items to be reported on an agency's balance sheets. If the assets were deteriorating at a faster rate than they were being repaired, it would create a long-term liability that should be disclosed in annual financial reports. GASB34 also emphasizes Asset Valuation, or the assignment of monetary value to infrastructure assets. The concept is that if roadway elements are described as public assets and valued in monetary terms, the public imperative to preserve them in sound condition is enhanced.
The 1999 standards added a new requirement for agencies to include a clear non-technical Management Discussion and Analysis (MD&A) addressing basic facts regarding whether the infrastructure conditions were improving, declining or sustaining. The MD&A was to report, among other things, significant changes in the assessed condition of assets from earlier assessments, how conditions compare to targets, and any significant differences between what was budgeted to be invested in preservation from what actually was spent.
This concept in U.S. public accounting represented at the time a major shift in focus. In the past, accounting reports represented only short-term balances of accounts for the current year, or biennium. As the GASB guidance made clear, snapshots of short-term account balances provide the public or policy makers little insight into whether current investment levels and maintenance practices are sufficient to ensure the long-term performance of major infrastructure. As the GASB 34 guidance explains "....the citizenry, legislative and oversight bodies, and investors and creditors, also need information about the probable medium-and long-term effects of past decisions on the government's financial position and financial condition. Without that information, these groups cannot assess the probable effect of current-period activities on the future demand for resources, or whether the government can continue to meet its service objectives and financial obligations in the future,". GASB guidance at the time summarized the rationale for the reporting standards in the following way. "In short, the new annual reports should give government officials a new and more comprehensive way to demonstrate their stewardship in the long term in addition to the way they currently demonstrate their stewardship in the short term through the budgetary process." [8]
GASB 34 as an auditing framework was intended to complement other frameworks such as asset management by focusing upon the financial implications of the results, or lack thereof, of these other systems. Government auditing agencies play a fundamental role in public governance. They ensure compliance with financial laws and reporting standards, and by doing so, provide public transparency by ensuring the accuracy and completeness of agency financial reports. The GASB 34 requirements cast the analytic results of the other management systems and practices into a format suitable for satisfying the fiduciary requirements of audit statutes and agencies. GASB 34 requirements also were expected to play an important financial role when agencies seek bond ratings. Bonding agencies seek long-term stability, or sustainability, in an agency's finances before awarding a sound bond rating. Based on that rating, bond investors can be assured they are highly likely to be repaid and that the agency is operating in a fashion that ensures its financial soundness for many years, often up to 30 years in the case of some bonds.
In 2008, NCHRP Report 608, "GASB 34: Methods for Condition Assessment and Preservation," examined how States were implementing the GASB 34 standards. It reported that States that were strong practitioners of TAM tended to have robust GASB 34 reports, while those that were not tended to have more perfunctory depreciation reports. [9]
Agencies have two ways to report. The first approach is the depreciation method which generally applies "straight line" depreciation to categories of assets and assigns a value to the depreciation. The value of the depreciation is compared to what is spent on infrastructure preservation to determine if preservation expenditures are adequate. The second approach, the modified approach, is more sophisticated and generally relies on more detailed comparison of expenditures and depreciation. In the modified approach, the agency's management systems often provide condition and depreciation information that is more robust.The GASB 34 requirements call for the Management Discussion and Analysis to be included in the agency's annual Comprehensive Annual Financial Reports (CAFR). These were envisioned to serve like a publicly traded corporation's annual report to shareholders. They would allow the public to understand the long-term health of the infrastructure and understand the long-term consequences of current investment decisions.
However, the transportation agencies interviewed in NCHRP 608 reported that their CAFRs received little attention and had become "just one more administrative task." "We also find that the agencies report that they receive very little interest in this information from outside entities such as legislative bodies, the investment community or the general public. It was widely hoped that provision of this information would spark interest in the condition and preservation of infrastructure assets - the factors that seem to have precluded interest are discussed in this report."
A review of NCHRP 608 and several of the individual State CAFRs reveal several reasons for the possible lack of interest in the CAFRs.
First, many of the CAFRs reviewed for this report read like accounting reports which are heavily laden with tables of numbers and accounting categories that do not explicitly state whether roadway conditions are declining or improving.
Secondly, the value of assets are grouped in ways that tend to obscure whether particularly important asset classes are improving or degrading. For instance, the overall value of highway assets includes the value of new construction and the underlying land, earthworks and buildings owned by the State. These categories increase the value of overall assets and tend to mask the decrease in value of key asset categories, such as pavement surfaces, bridge decks or maintenance appurtenances such as signage. The actual value of pavement surfaces or bridge decks are not reported separately and their decreasing asset value is offset when the value of new construction is included in the asset base value.
Third, several states set lower threshold values for GASB 34 targets than they set for their internal asset management targets. The result is that lower levels of expenditures are needed to prove "sufficiency" in GASB reports. While a State may strive for 90 percent achievement of pavement targets as an asset management goal, it may set a target of 80 percent for its GASB target. Only a careful reading of the asset management reports compared to the CAFR will identify why the CAFR reports targets are met while the asset management reports indicate that asset conditions are declining. One State reviewed for this report produced a pavement forecast report that reported substantial declines expected in its pavement conditions. However, the State's CAFR reported pavement targets were met. Also in some states contacted, the asset management staff did not coordinate with the finance staff that produced the agency's CAFR.
Fourth, and related to the third issue, is that if a State fails to meet a GASB condition target the GASB rules state it should shift from using the more sophisticated "modified approach" to the less sophisticated "depreciation approach." Therefore, the states that want to retain the more robust reporting process face a disincentive if they candidly report that asset condition targets are not met.
Fifth, the CAFRs of some states address only two to three years, preventing long-term trend lines of asset conditions from being apparent. A reader would need to review multiple years of reports in order to understand the long-term asset-condition trends.
Sixth, the CAFRs are inherently backward looking and do not include forecasts. Therefore, only assumptions of future performance can be inferred from them.
Seventh, the GASB rules do not allow the investment of many asset replacements to be added as capital, but instead say they must be treated as an expense. For instance, if an existing deteriorated bridge is replaced with a new bridge, the new bridge is not included as new, increased "capital" or "equity" but rather must be reported as an expense. The transportation officials interviewed in NCHRP 608 disagreed with this GASB interpretation because it causes the agency's investment in infrastructure renewal to be understated.
Although the GASB 34 requirements were developed to raise public understanding of and interest in infrastructure conditions, they had not appeared to have done so to the extent hoped for in 2001.
Some State's CAFRs do provide a long-term perspective regarding asset conditions and expenditure levels. For instance, the Kansas Department of Transportation provides information showing that pavement and bridge condition targets are being met, that minimum investment levels have been largely achieved and that overall asset values have increased.
For instance, it notes that minimum pavement conditions for Interstate Highway and non-Interstates have continually surpassed minimum targets, as seen in Table 38.
| Pavement Conditions and Expenditures | ||||
|---|---|---|---|---|
| Interstate Miles | Non-Interstate Miles | |||
| Minimum Acceptable Condition | Actual Condition Level | Minimum Acceptable Condition | Actual Condition Level | |
| 2008 | 80 | 96 | 75 | 85 |
| 2009 | 80 | 97 | 75 | 86 |
| 2010 | 80 | 97 | 75 | 86 |
| Estimated Expenditures to Maintain System at Minimum Acceptable Condition | Actual Expenditures | Estimated Expenditures to Maintain System at Minimum Acceptable Condition | Actual Expenditures | |
| 2006 | $110,000 | $115,820 | $260,000 | $390,988 |
| 2007 | $110,000 | $62,935 | $260,000 | $384,627 |
| 2008 | $110,000 | $68,654 | $260,000 | $363,582 |
| 2009 | $110,000 | $67,603 | $260,000 | $392,237 |
| 2010 | $110,000 | $54,807 | $260,000 | $335,108 |
| Amounts in Thousands$ | ||||
The Kansas DOT reports (Table 39) that net assets, including the value of highway assts, have risen 22 percent in nine years and that expenditures for roadway maintenance, preservation and expansion have increased 34 percent.
| 2002 | 2003 | 2004 | 2005 | 2006 | 2007 | 2008 | 2009 | 2010 | Change | |
|---|---|---|---|---|---|---|---|---|---|---|
| Net Assets | $8,455,364 | $8,543,320 | $8,585,739 | $8,757,169 | $8,932,372 | $9,270,951 | $9,518,480 | $9,986,964 | $10,337,675 | 22% |
| Maintenance, Preservation, Expansion and Related Expenses | $1,080,294 | $1,082,568 | $1,182,808 | $1,227,139 | $1,242,339 | $1,259,426 | $1,260,003 | $1,268,474 | $1,443,590 | 34% |
| (Thousands$) | ||||||||||
These types of reports do serve the function of indicating that the departments are reasonably able to meet their infrastructure needs, they have grown the State's assets and that performance targets are being met.
A possible enhancement to the GASB 34 reports could be further granularity in reporting for critical asset classes, such as illustrated in Figure 69. Such granularity could disaggregate the effects of investment and allow greater understanding whether overall asset values were rising because of sound infrastructure investment in existing assets or if asset values are rising because of adding new highway facilities. The adding of new facilities increases long-term maintenance costs. The granularity of asset valuation change by asset class could increase understanding of whether critical roadway assets are increasing or decreasing in value.
[8] Government Accounting Standards Board, 1999, "Summary of Statement No. 34 Basic Financial Statements-and Management?s Discussion and Analysis-for State and Local Governments" accessed at http://www.gasb.org/st/summary/gstsm34.html accessed l 6, 2011.
[9] Chait, Edward P. "Report 608 GASB Methods for Condition Assessment and Preservation," National Cooperation Highway Research Program, pg. 1.
| << Previous | Contents | Next >> |