| << Previous | Contents | Next >> |
This case study illustrates how a Maintenance Sustainability Ratio can be computed using data from a State's maintenance management system. The case study illustrates that the MSR can be an important component of decision-making. However, the case study also illustrates the caution that must be used in interpreting the MSR values. The accuracy of the MSR is no better than the accuracy of the inventory condition data that underlies it. Because maintenance management systems must address a large number of assets, over a large area which can change significantly year to year, a good deal of engineering judgment is necessary for interpreting short-term, or geographically specific Maintenance Sustainability Ratios.
Since 1997, Utah DOT (UDOT) has been using the Maintenance Management Quality Assurance program to evaluate the effectiveness of its maintenance program. The program provided various reports to support data-driven decisions. The agency used historical budget information adjusted for inflation in making maintenance allocations for future years. The program was modified in 2003 to provide some enhanced decision-support features that included:
The enhanced program is called Maintenance Management Quality Assurance Plus (MMQA+). The MMQA+ helps the agency address its strategic goal of "Taking Care of What We Have" at the statewide, regional and station level.
The MMQA+ program is expected to provide valuable information to:
The information from MMQA+ with few modifications will provide all the information that the agency needs to compute the Maintenance Sustainability Ratio component of the Asset Sustainability Index.
The agency acknowledges that with between 200 to 400 agency personnel at the station level inspecting 19 major categories of maintenance activities there are bound to be differences in the identification, scoring and reporting of deficiencies.
The data that are input at the station level are summarized and uploaded to the regional level. These data are further summarized at the regional level and uploaded to provide statewide reports on the LOM of each activity.
Across the nation, agencies are changing the focus from expansion and building of new infrastructure to preserving and maintaining the existing infrastructure. Agencies have also developed systems and processes to help them monitor and report on the condition and performance of the system. This focus on preserving and maintaining its infrastructure resulted in UDOT receiving the highest rating from Governing magazine of any State for taking care of its infrastructure in 2005.
The agency has successfully used the information and performance of its maintenance activities to inform the legislature about how it uses the maintenance funds to take care of the transportation infrastructure under its charge. The agency focuses on preserving and maintaining its infrastructure and has the legislature echoing its philosophy that "Good Roads Cost Less."
To ensure consistency in the collection and reporting of the condition of the infrastructure, as well as to ensure a common understanding of all maintenance deficiencies, the agency has focused attention and resources on training. The agency has one person in the central office focused on training the field personnel on how to conduct the inspections. The agency also conducts audits of maintenance activities for quality-assurance purposes. Additionally, UDOT also has an MMQA+ manual that provides detailed instructions about desired conditions, reporting guidelines and what constitutes a feature being "deficient." The reporting guidelines also provide information about the measurement frequency, measurement area and how to record the count of deficiencies. They also provide photographs for each maintenance activity to help the inspector differentiate between deficient and non-deficient features.
To work towards a common goal for performance of maintenance activities, statewide targets are set for each maintenance activity. Targets are expressed as letter grades A, B, C, D or F. The targets at the statewide level are generally set to be A through C. These statewide targets also apply to the regions and stations. Each route is divided into segments and stations are responsible for multiple segments of a route.
The expectation is for each station to achieve, but not exceed, its performance target. Station personnel inspect assigned routes and record both the total number of features that need to be maintained, as well as the number of deficient features. The data from the inspection are entered into the MMQA+ software. The system then computes the LOM and assigns a score from A through F. Reports generated by the software allow the agency personnel at different levels of the organization to review the performance achieved for each maintenance activity. Reports also provide valuable information to manage available budget and other resources. It also allows the stations to prioritize and focus on specific activities based on agency priorities, current conditions, available budget and achievement targets.
The agency tracks close to twenty maintenance features. For this study and proof of concept of the Maintenance Sustainability Ratio, the following five maintenance features/activities are being studied:
The station personnel can view in the MMQA+ system the performance target that has been set for each of the maintenance activities for the station. Based on current conditions of maintenance features, available budget and target performance, the station supervisor prioritizes and schedules work activities.
The frequency of measurement varies with the activity. For example, Signs and Posts are inspected at least bimonthly. The remaining four activities are inspected semi-annually. The inspection involves identifying the percent of deficient features to total features. For each measurement, the MMQA+ manual provides detailed information about the following:
Based on the number of deficient items identified and entered into the system, the software computes the LOM and assigns a letter grade based on the number of deficiencies recorded in the MMQA+ system. Table 24 below shows the grades for the five maintenance features discussed in this study.
| Percent Deficient | Grade | Percent Deficient | Grade |
|---|---|---|---|
| 0.00 - 3.43 | A+ | 26.82 - 30.00 | C- |
| 3.44 - 6.83 | A | 30.01 - 33.40 | D+ |
| 6.84 - 10.02 | A- | 33.41 - 36.79 | D |
| 10.03 - 13.42 | B+ | 36.80 - 39.99 | D- |
| 13.43 - 16.82 | B | 40.00 - 43.39 | F+ |
| 16.83 - 20.01 | B- | 43.40 - 46.78 | F |
| 20.02 - 23.41 | C+ | 46.79 - 100.00 | F- |
| 23.42 - 26.81 | C |
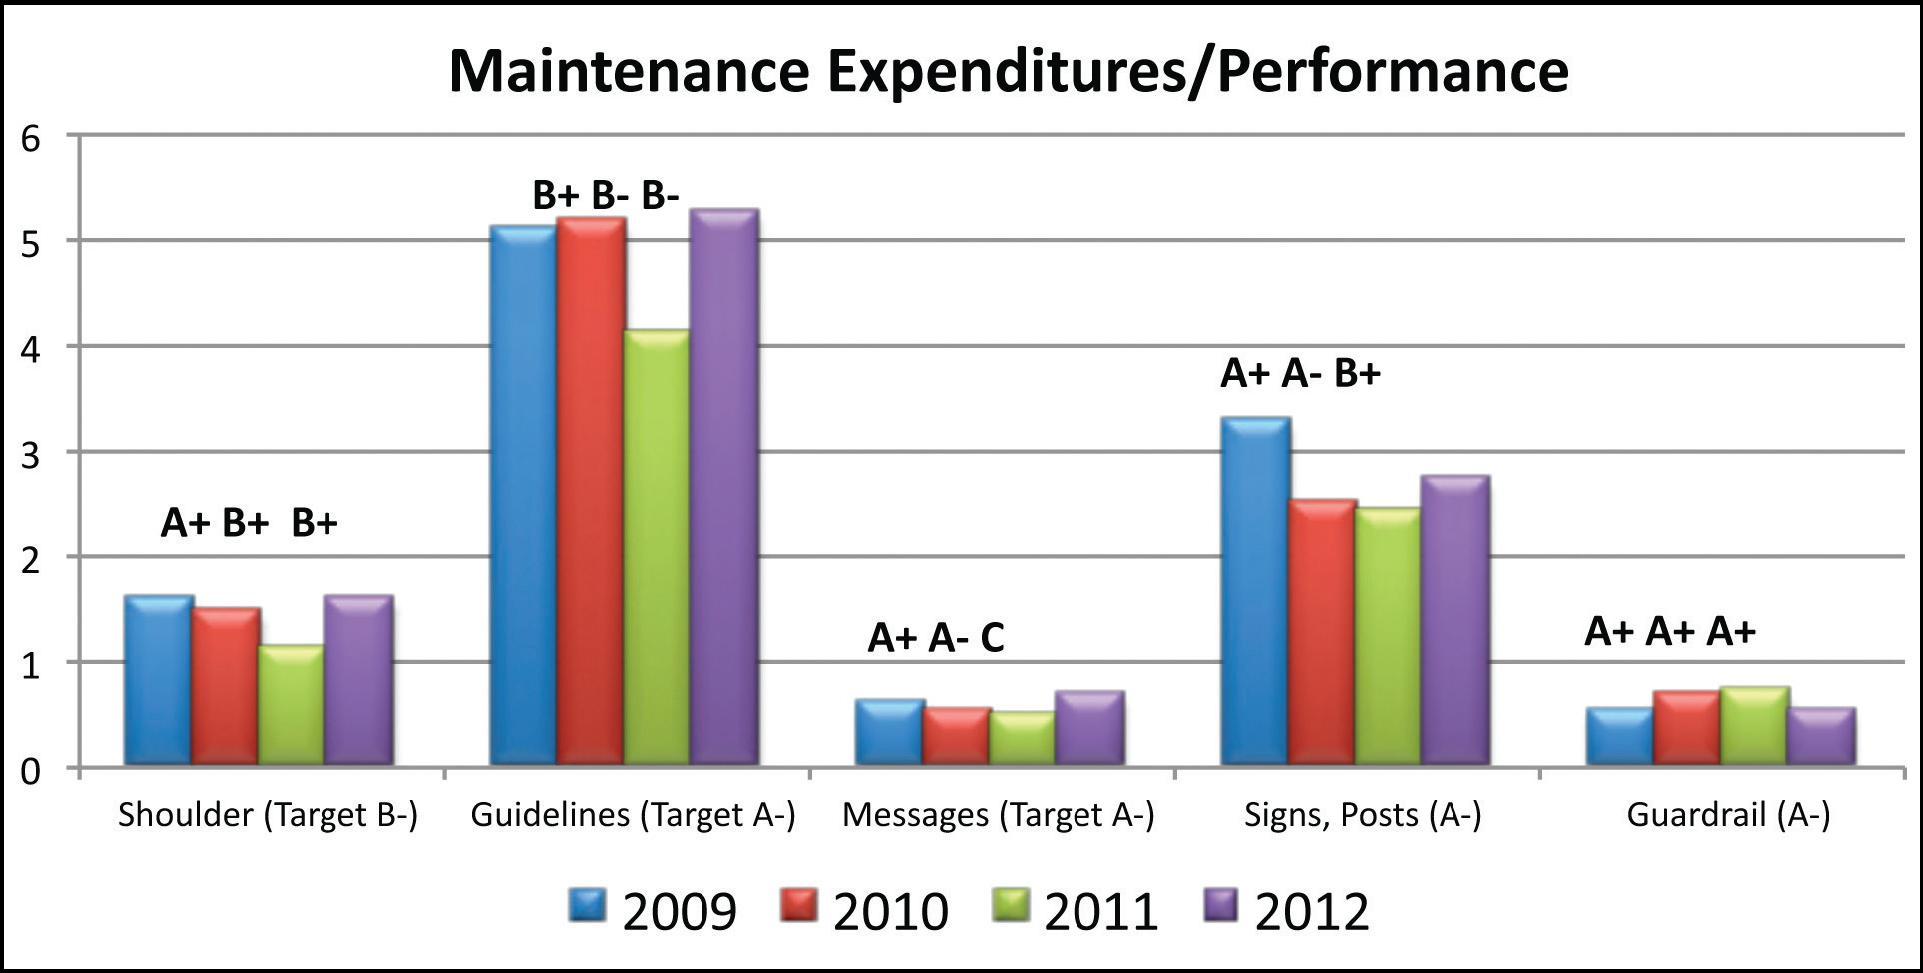
Figure 50 below shows the target, performance achieved and amount expended for the five maintenance features from 2009 through 2011. It also shows the budgeted amount and the target of performance established for 2012.
Figure 50: Targets, Performance, Expenditure and Budgeted Amounts.
Figure 50 shows that amount budgeted for 2012 for each of the maintenance activities is higher than the amount spent in the previous three years with the exception of guardrail. The next few charts will discuss each maintenance activity in more detail.
Table 25 shows the target, score and expenditure for 2009 through 2011 for Shoulder Work. It also shows the target and the amount budgeted for Shoulder Work for 2012.
| 2009 | 2010 | 2011 | 2012 | |
|---|---|---|---|---|
| Shoulder Work - Letter Target | B- | B- | B- | B- |
| Shoulder Work - Letter Score | A+ | B+ | B+ | |
| Shoulder Work - Target | 20.01 | 20.01 | 20.01 | 20.01 |
| Shoulder Work - Score | 0.3475 | 10.665 | 13.1625 | |
| Shoulder Work - $ Spent | $1,582,355.75 | $1,467,542.00 | $1,116,167.65 | $1,590,000.00 |
Figure 51: Shoulder Work - Score, Target and Expenditure.
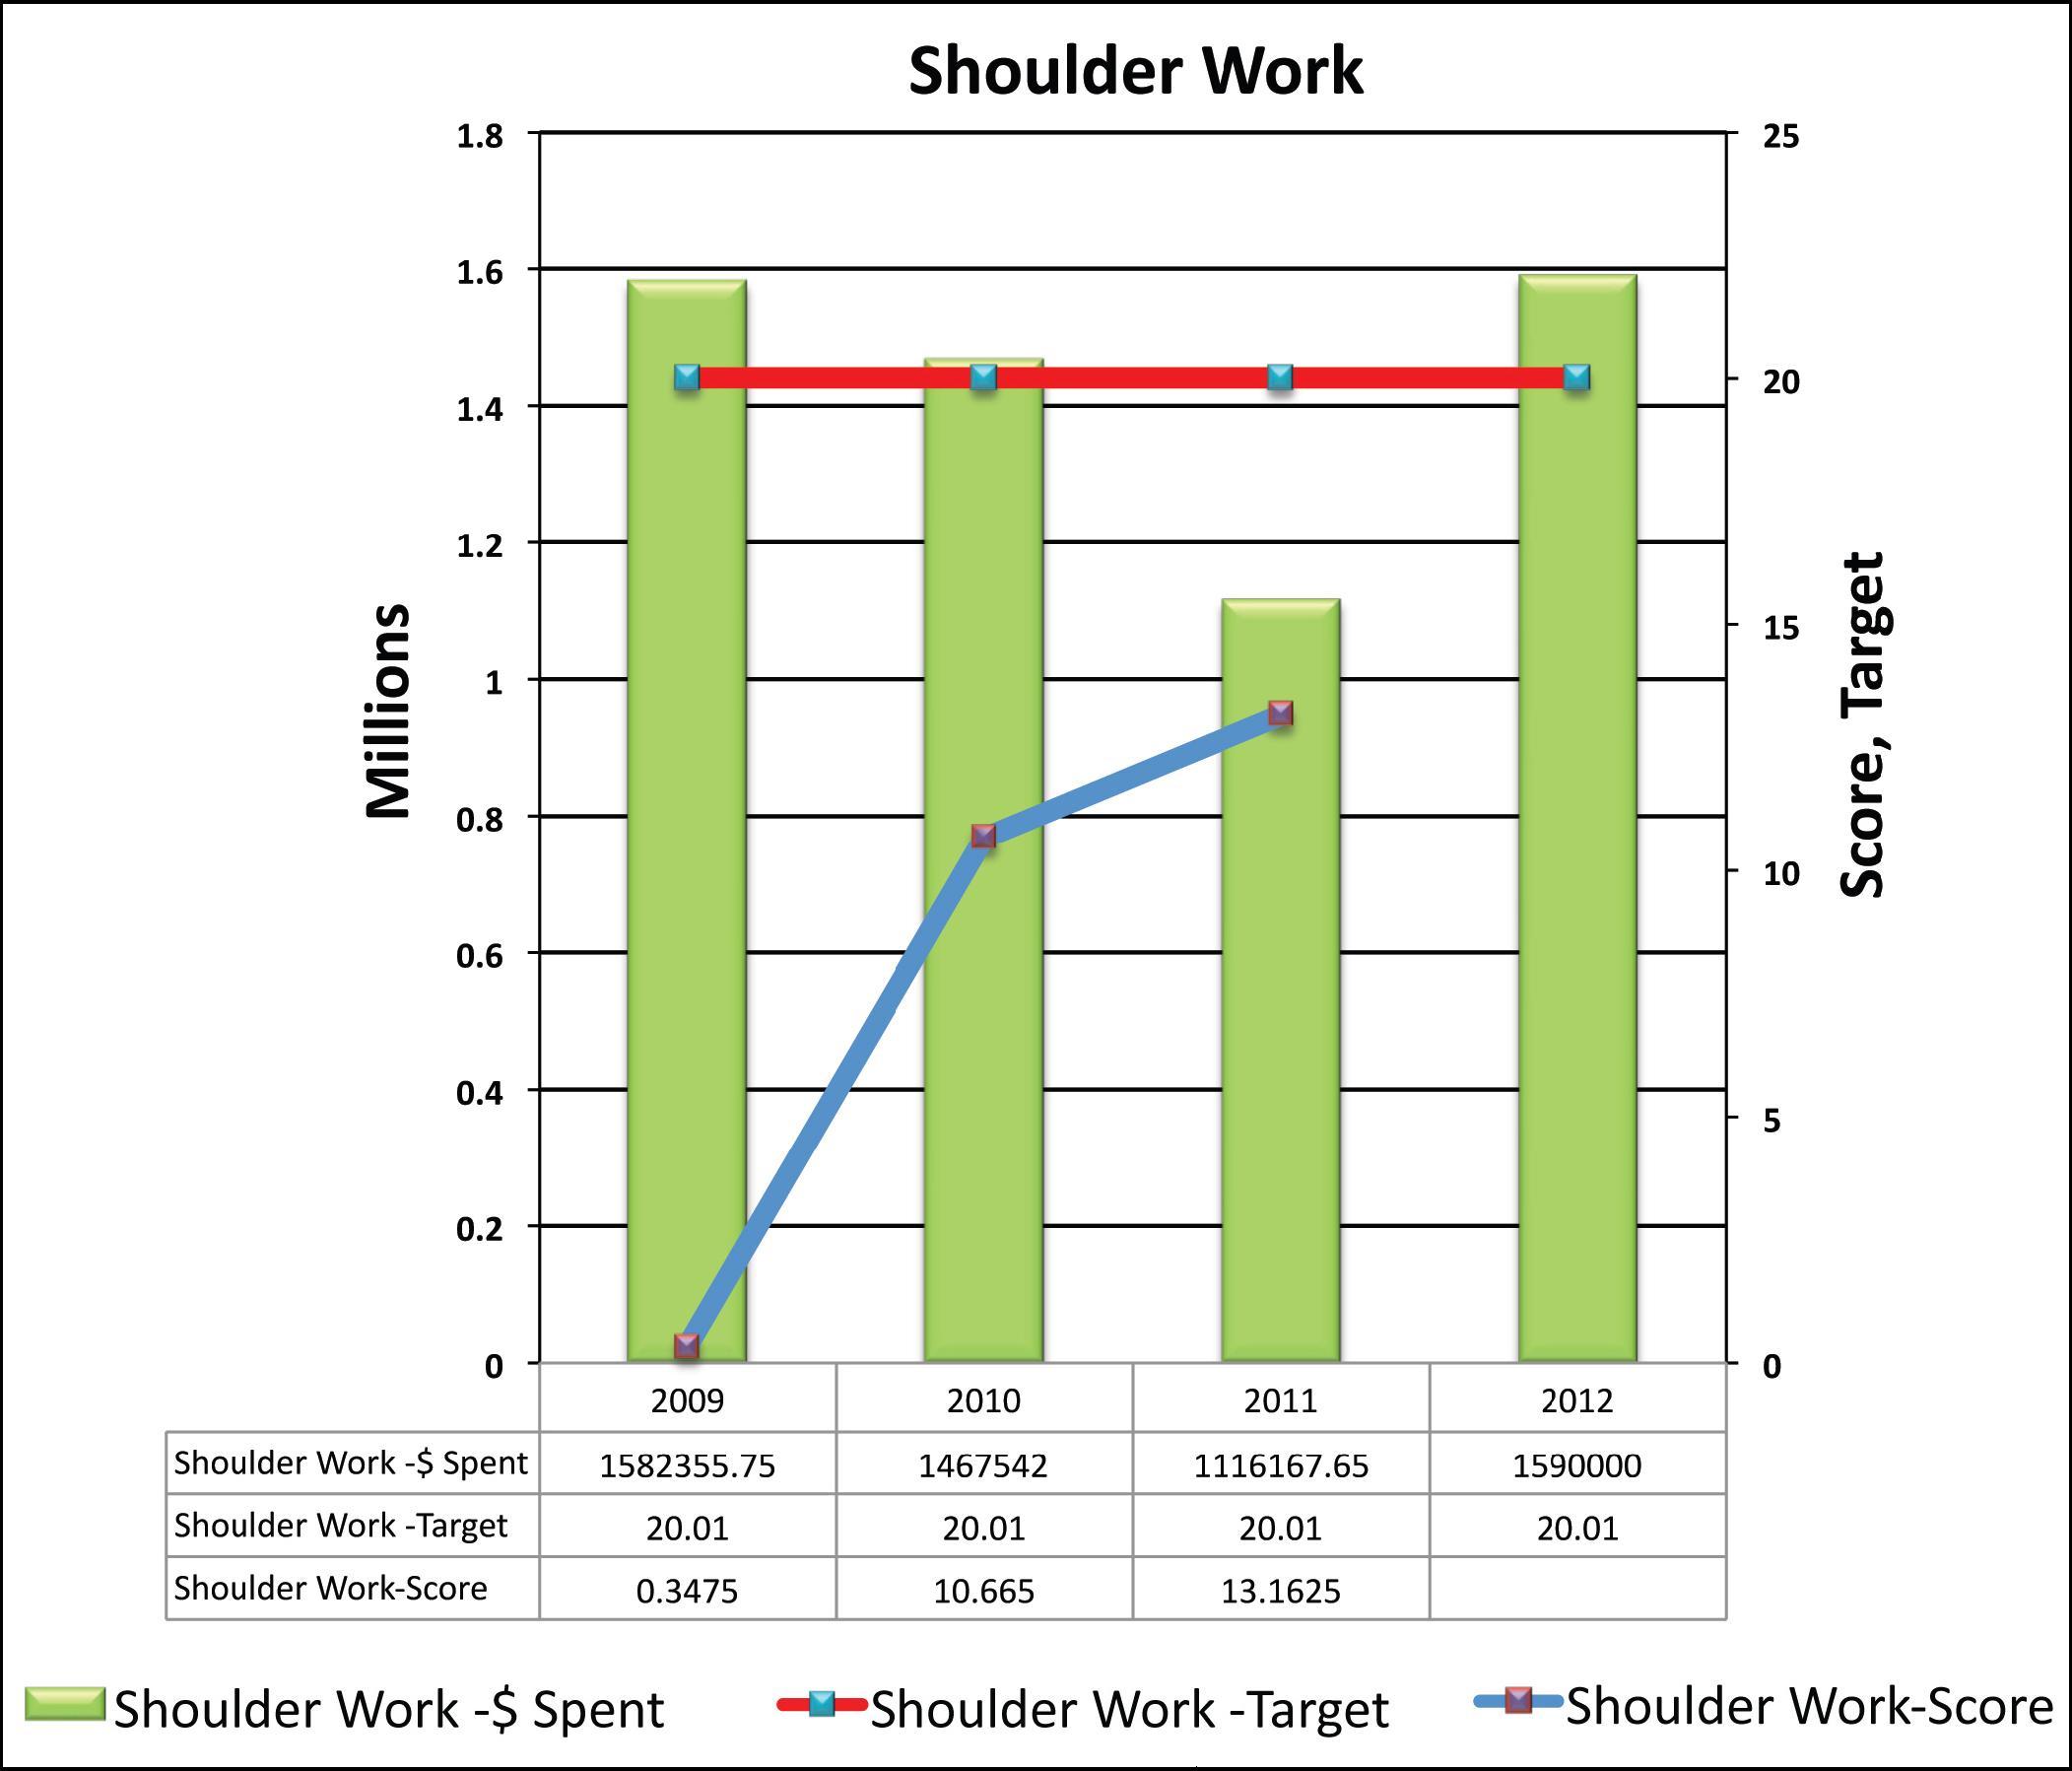
Figure 51 shows in red the target performance established for Shoulder Work. Deficiencies are not to exceed 20.01 but were much lower as seen in the blue line. The overall score for shoulder work would indicate that the agency scored much better than the target that was established in 2009, 2010 and 2011.
The Maintenance Sustainability Ratios are intended for long-term budgeting and programming decisions. When computing the Maintenance Sustainability Ratio (MSR) the focus is to achieve the performance target that has been established over the long term. For any given year, or for any given asset such as shoulders, the Sustainability Ratio may be less useful because conditions such as shoulder conditions can change rapidly.
Figure 51 shows that the agency achieved a score that is better than (below) the established performance target of allowable deficiencies. It appears that the agency could have spent less in 2009, 2010 and 2011 to achieve the established target of a "B-" instead of exceeding the target and achieving an "A+". However, because shoulders can change rapidly, an agency may want to have higher-than-target conditions to allow for "robustness" in case of heavy rains or other factors that could rapidly erode shoulder conditions. Figure 51 and Table 25 show that the agency anticipates that an increase in funds will be needed to address shoulder work in 2012. After deficiencies increased in 2010 and 2011, the agency will increase expenditure to 2009 levels to address the growth in shoulder deficiencies.
| 2009 | 2010 | 2011 | 2012 | |
|---|---|---|---|---|
| Pavement Striping - Letter Target | A- | A- | A- | A- |
| Pavement Striping - Letter Score | B+ | B- | B- | |
| Pavement Striping - Target | 10.02 | 10.02 | 10.02 | 10.02 |
| Pavement Striping - Score | 10.99 | 19.755 | 19.16 | |
| Pavement Striping - $ Spent | $5,088,059.05 | $ 5,167,910.00 | $ 4,116,958.00 | $5,268,754.00 |
Table 26 shows the target, score and expenditure for 2009 through 2011 for Pavement Striping. It also shows the amount budgeted and the target set for 2012.
Figure 52: Pavement striping condition, expenditures.
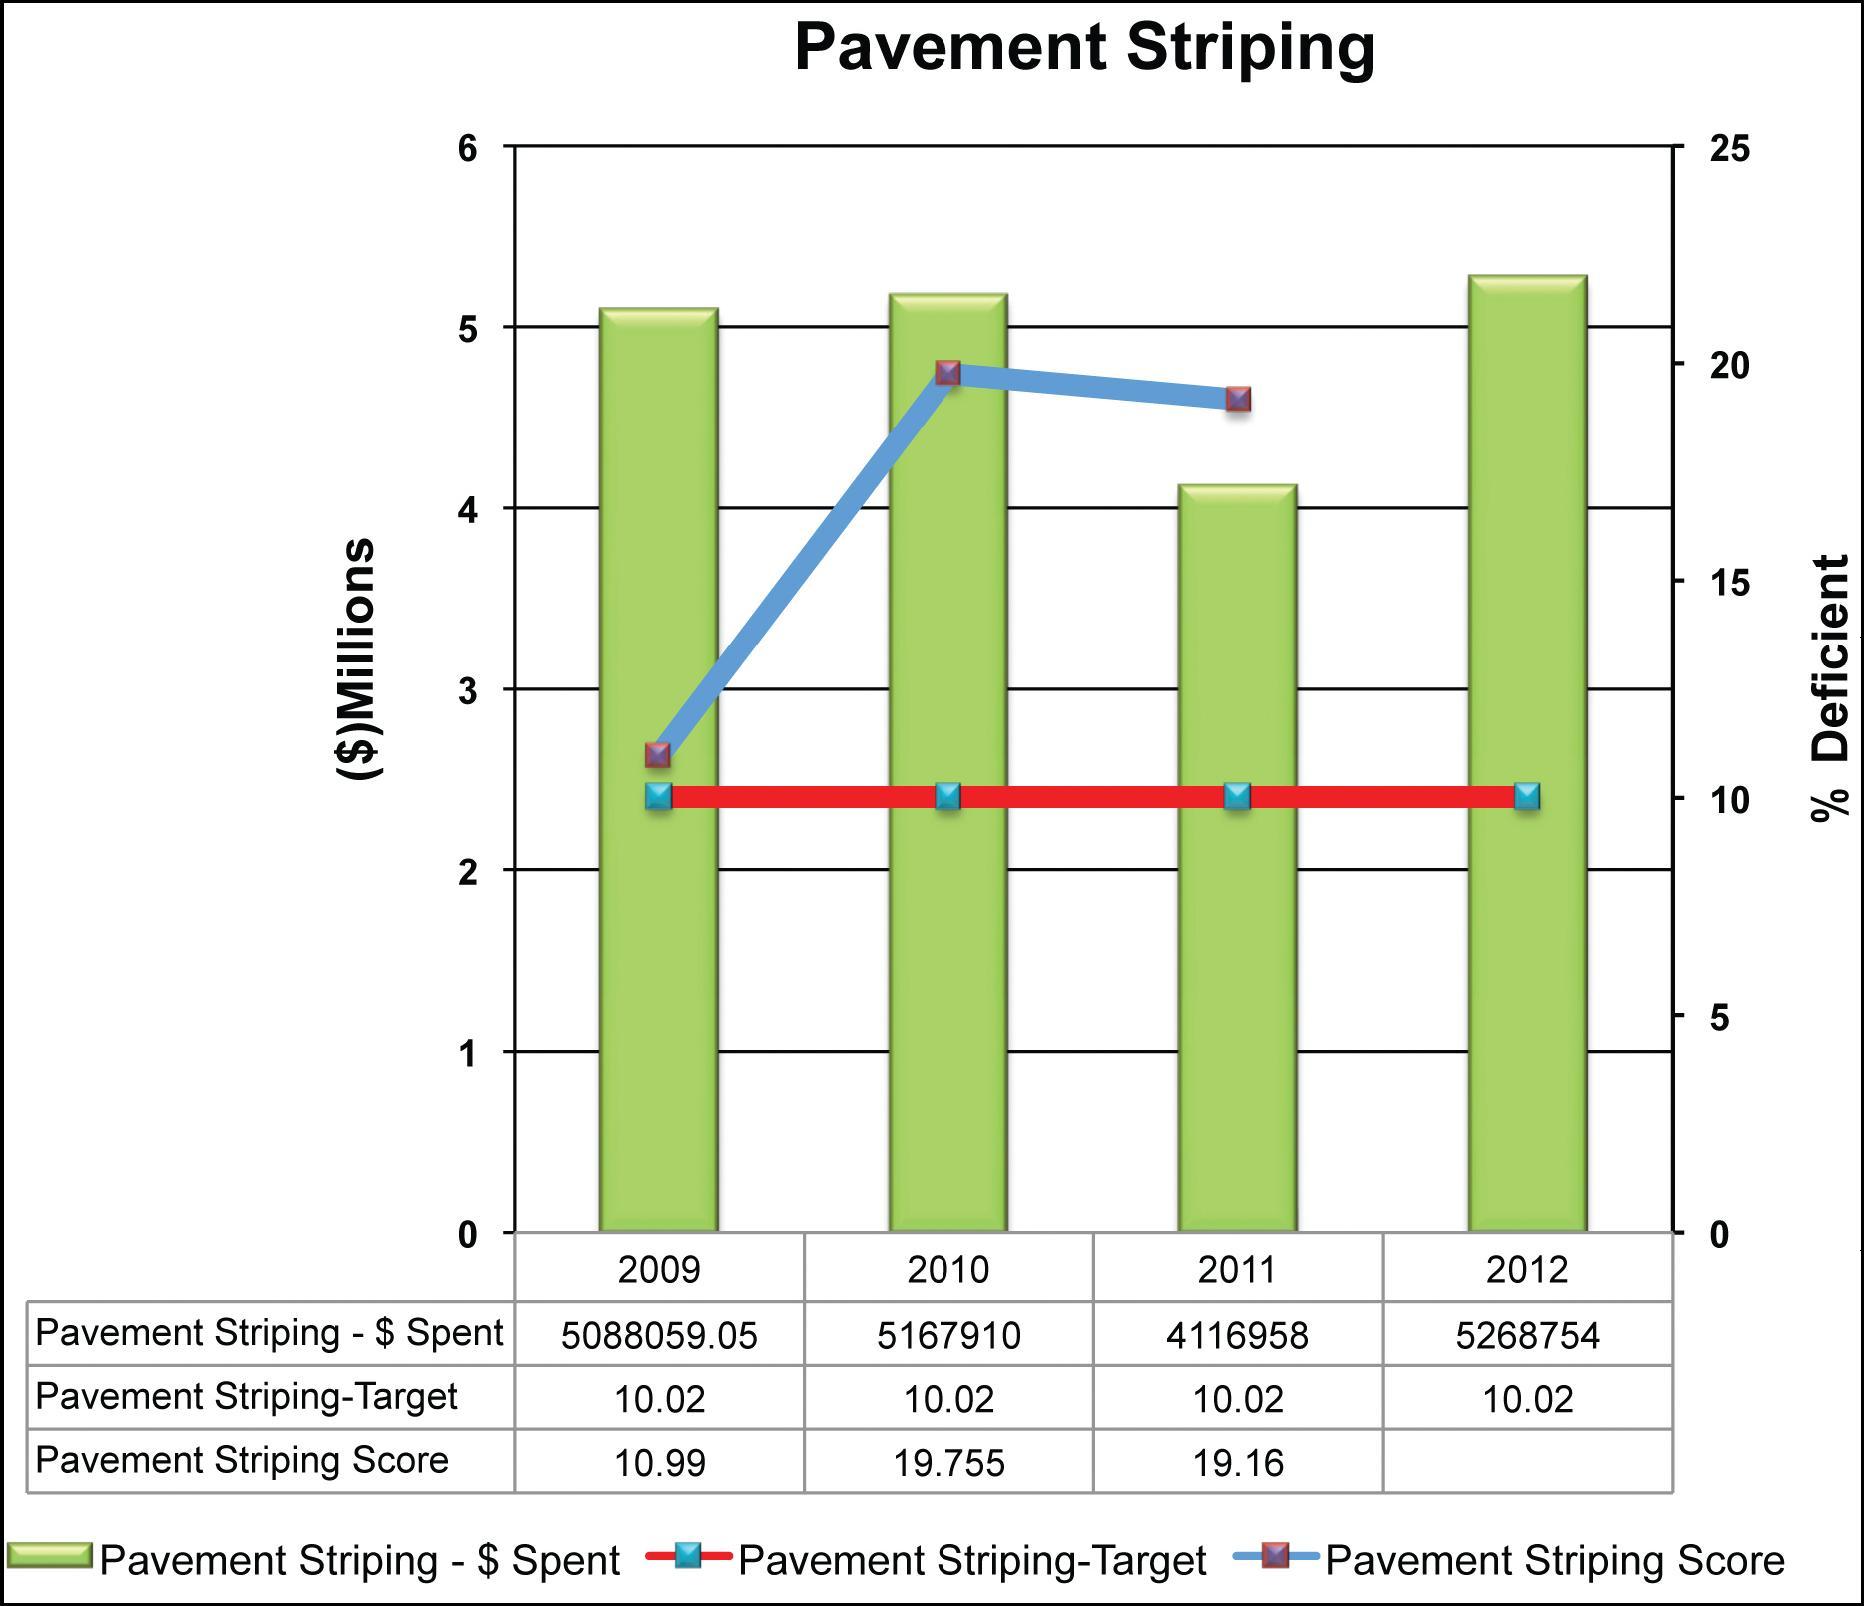
Figure 52 shows in red the target established for Pavement Striping for years 2009 through 2012. It shows in blue the scores achieved in Pavement Striping for years 2009 through 2011. The amount budgeted for 2012 and the expenditures incurred for years 2009, 2010 and 2011 are shown as columns in green.
| Maintenance Capital Budget Maintenance Capital Needs |
= Maintenance Sustainability Ratio |
The optimum MSR is a 1.0. Table 26 shows that the agency was close to achieving an optimum MSR in 2009 for pavement striping. It also shows that for 2010 and 2011, the percentage of deficiencies was much higher than that permitted by the target and accordingly the agency?s score in both years was below target. This would also indicate that the amount budgeted for 2010 and 2011 in the area of Pavement Striping was not sufficient to meet the needs. The amount budgeted for 2012 is more $1 million above the amount spent for 2011 and it is assumed that this amount would be sufficient to achieve the target performance for 2012.
| 2009 | 2010 | 2011 | 2012 | |
|---|---|---|---|---|
| Pavement Markings - Letter Target | A- | A- | A- | A- |
| Pavement Markings - Letter Score | A+ | A- | C | |
| Pavement Markings - Target | 10.02 | 10.02 | 10.02 | 10.02 |
| Pavement Markings - Score | 2.75 | 10.02 | 26.7 | |
| Pavement Messages $ Spent | $597,368.86 | $524,566.00 | $486,754.00 | $672,195.00 |
Table 27 shows the target, score and dollars spent for 2009, 2010 and 2011 for Pavement Markings. It also shows the amount budgeted and performance target that has been established for 2012 for Pavement Markings.
Figure 53: Pavement marking targets, expenditures.
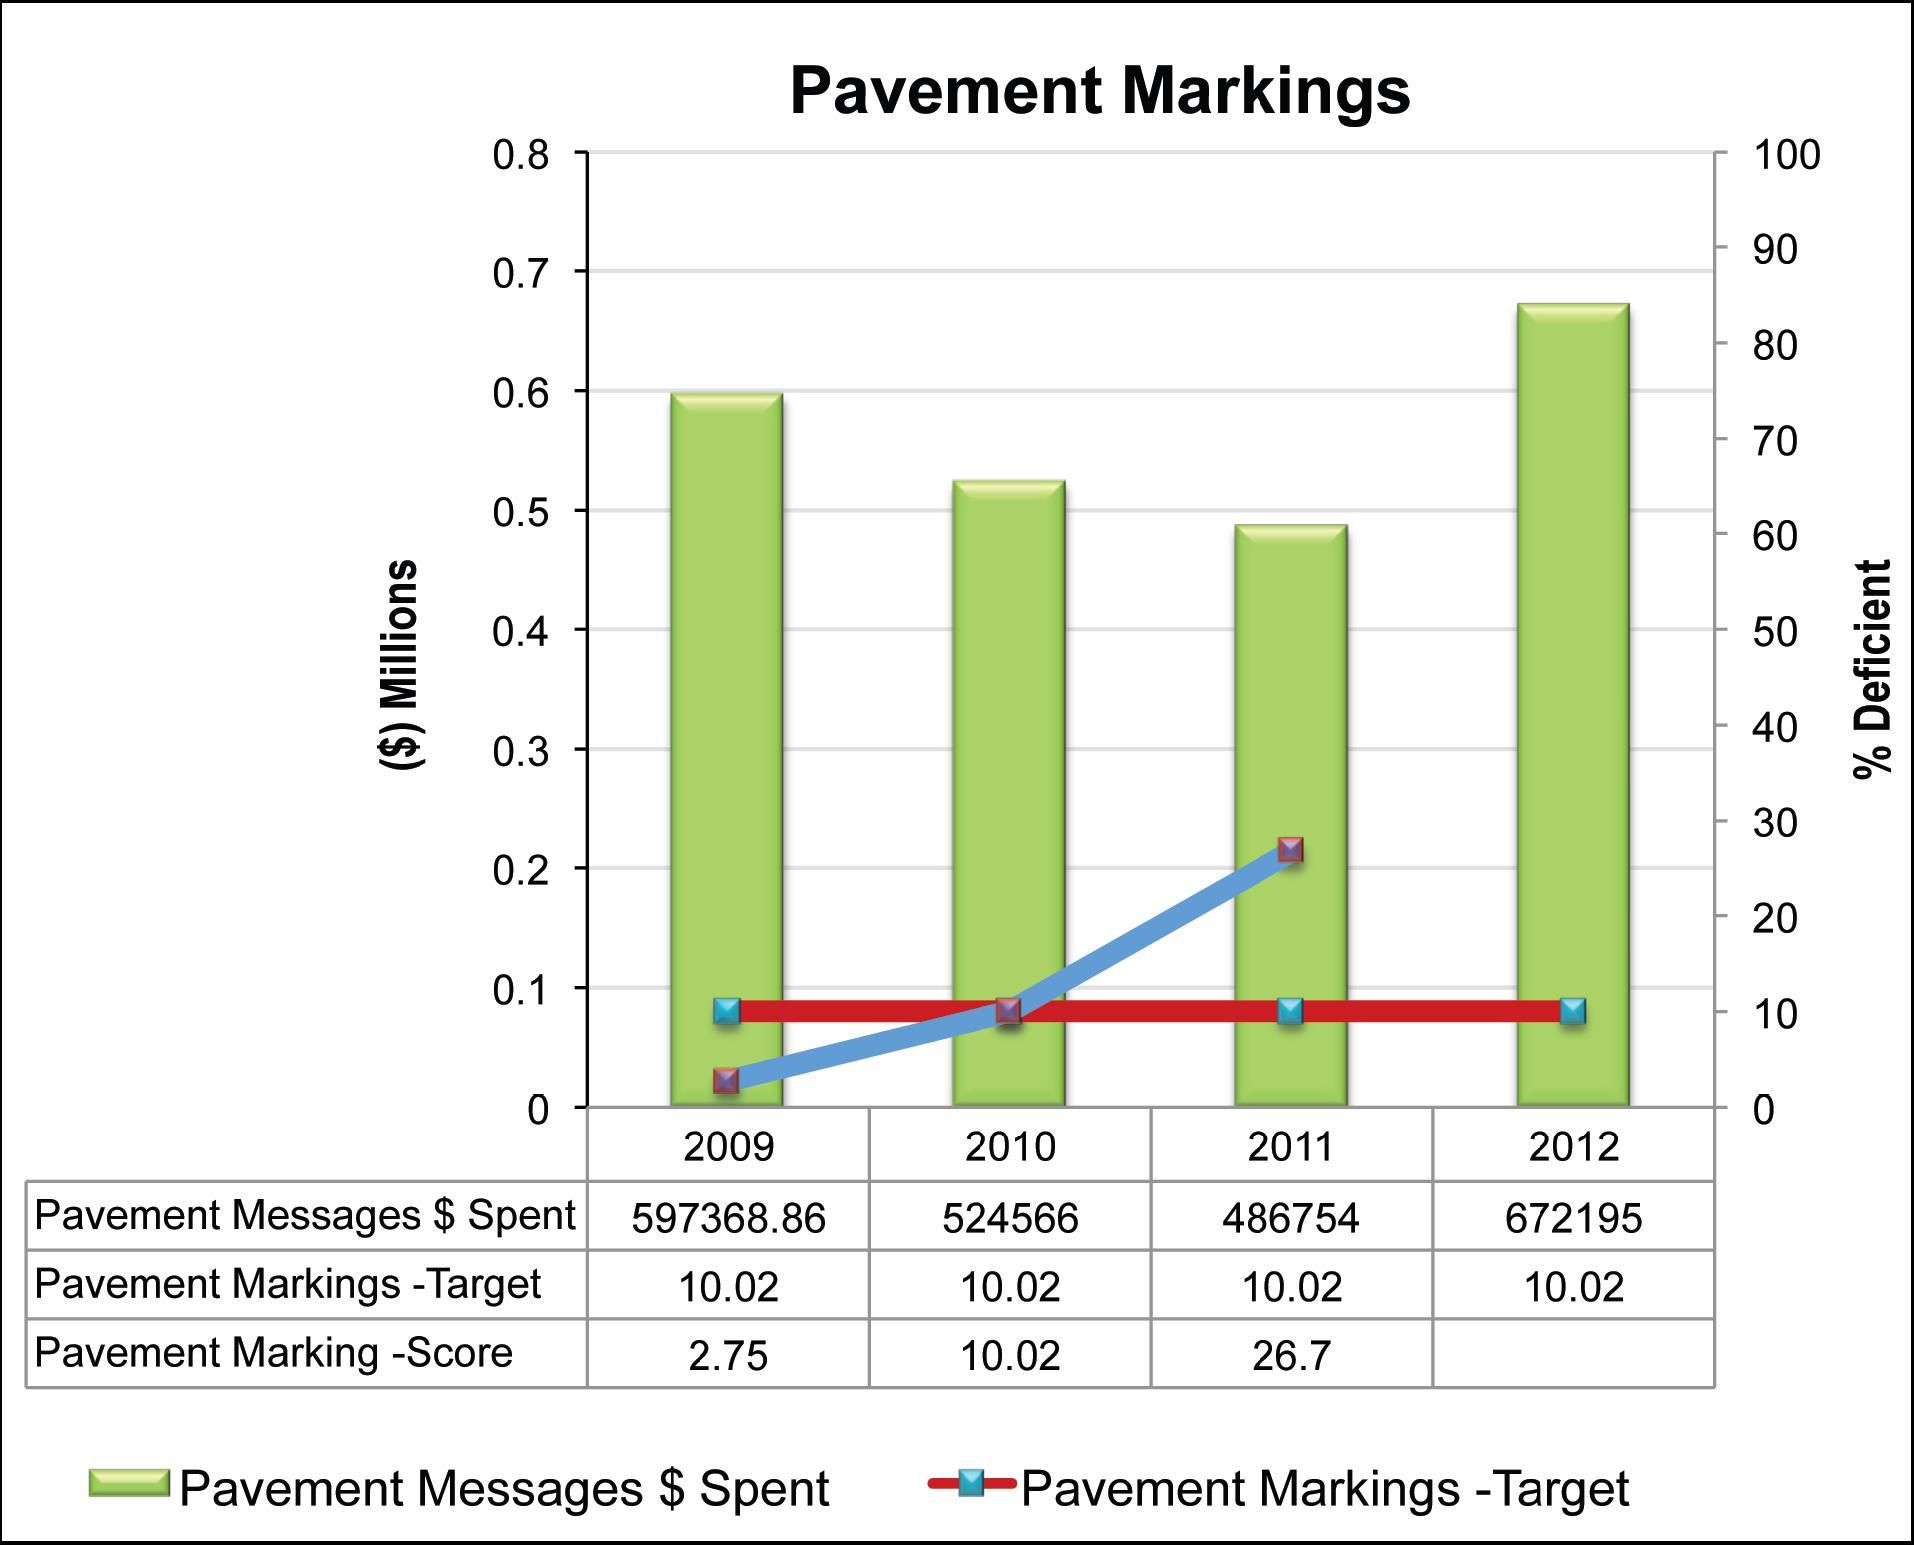
Figure 53 shows in red the target established for Pavement Markings for years 2009 through 2012. It shows in blue the scores achieved in Pavement Markings for years 2009 through 2011. The amount budgeted for 2012 and the expenditures incurred for years 2009, 2010 and 2011 are shown as columns in green.
Table 27 shows that in 2009 the score achieved for Pavement Markings is an "A+" which is higher than the target score of "A-" and in 2010 it achieved a score of "A-" which met target. However, in 2011 the score was "C".
In 2009, the agency exceeded the established target with the allocated funds. This indicates the MSR for 2009 is greater than 1.0. In 2010, the department exactly met target with a slightly smaller expenditure. In 2011, it reduced the expenditure again and the number of deficiencies rose to more than twice the number set in the target. In 2012, the agency increased its budget for pavement markings. This example illustrates how an agency adjusts budgets in an attempt to achieve the optimum MSR of 1.0.
| 2009 | 2010 | 2011 | 2012 | |
|---|---|---|---|---|
| Signs and Posts - Letter Target | A- | A- | A- | A- |
| Signs and Posts - Letter Score | A+ | A- | B+ | |
| Signs and Posts - Target | 10.02 | 10.02 | 10.02 | 10.02 |
| Signs and Posts - Score | 4.92 | 9.77 | 11.54 | |
| Signs and Posts - $ Spent | $3,279,576.71 | $2,515,046.00 | $2,406,382.00 | $2,719,846.00 |
Table 28 shows the target, score and expenditure for 2009 through 2011 for Signs and Posts and the amount budgeted and target established for 2012 for Signs and Posts.
Figure 54 shows in red the target established for the maintenance category Signs and Posts for years 2009 through 2012. The figure also shows in blue the scores achieved in Signs and Posts for years 2009 through 2011. The amount budgeted for 2012 and the expenditures incurred for years 2009, 2010 and 2011 are shown as columns in green.
Table 28 shows that in 2009 the score of an "A+" achieved for Signs and Posts is above the target required of an "A-". In 2010 the target score of an "A-" was achieved. In 2011 the statewide score for Signs and Posts was a "B+" which is below the target established of an "A-".
Figure 54: Sign, post conditions expenditures.
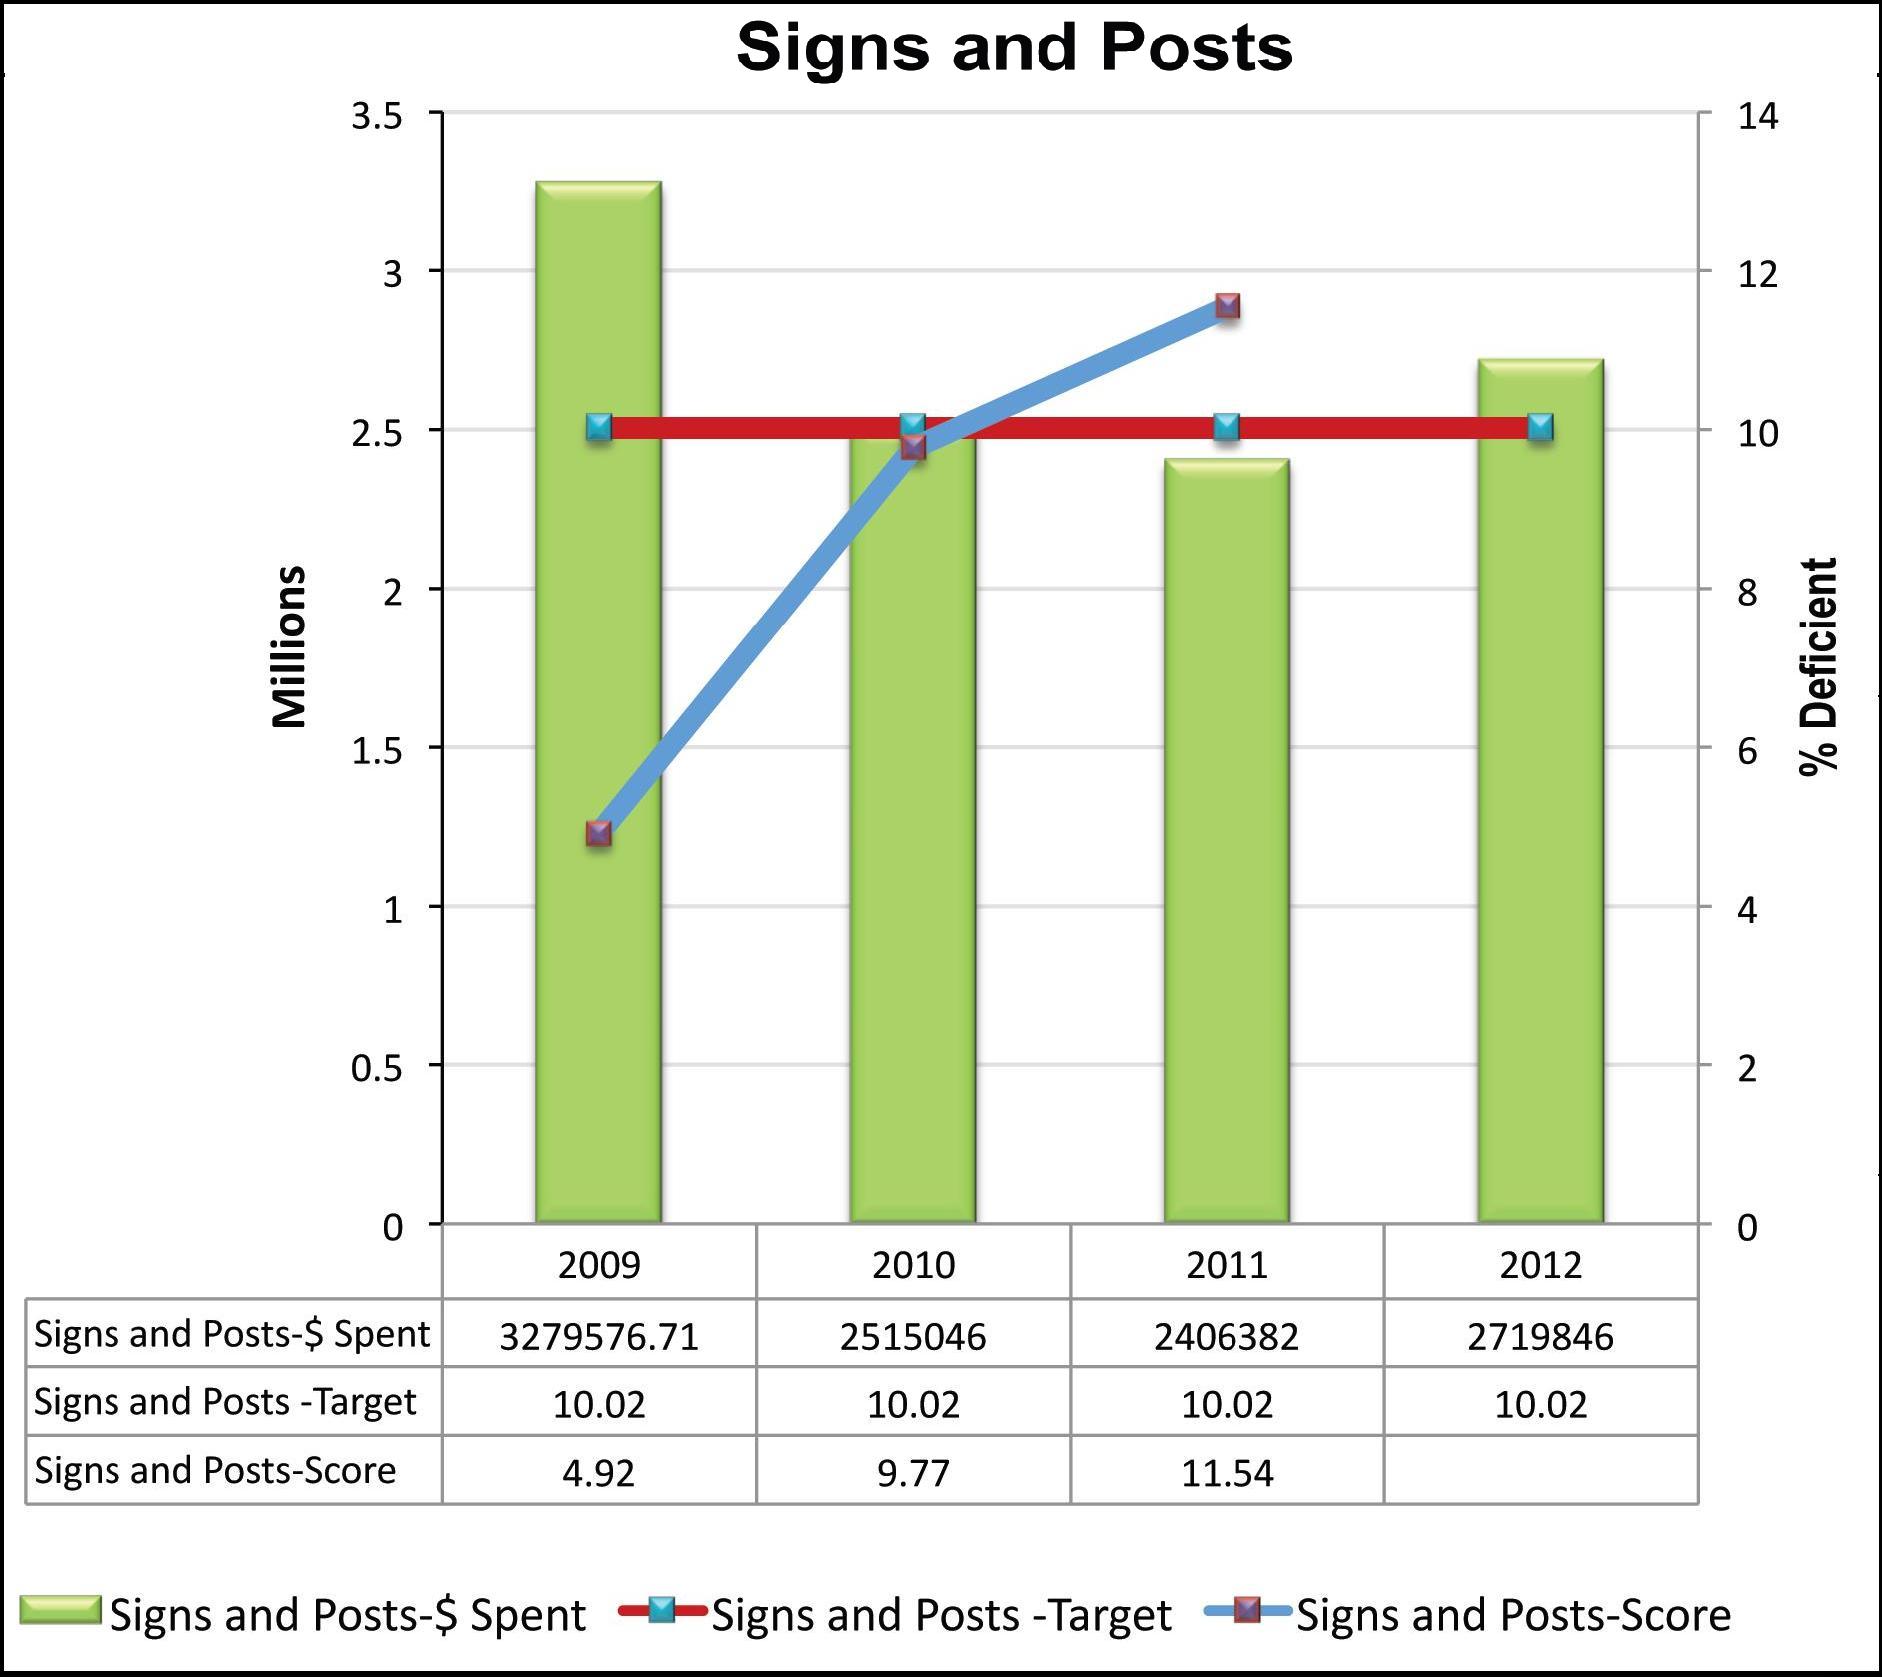
Since the score achieved for 2009 is above the expected target, the MSR for 2009 would be greater than 1.0 while the MSR for 2010 would be a 1.0 indicating that the amount spent met the condition needs to address Signs and Posts. In 2011 with an expenditure of approximately $ 2.4 million, the target score of "A-" was not achieved. If the MSR was computed for 2011 it would be a number slightly less than the optimum MSR of 1.0. However, the agency scores are very close to target. The agency increased the signs and posts budget slightly in 2012. In 2010, 2011 and 2012 the agency has fairly closely calibrated expenditures to remain near its target.
| 2009 | 2010 | 2011 | 2012 | |
|---|---|---|---|---|
| Guardrail - Letter Target | A+ | A+ | A+ | |
| Guardrail - Letter Score | A- | A- | A- | A- |
| Guardrail - Target | 10.02 | 10.02 | 10.02 | 10.02 |
| Guardrail - Score | 0.0225 | 2.42 | 2.5475 | |
| Guardrail - $ Spent | $1,582,355 | $1,467,542 | $1,116,167 | $1,590,000 |
Table 29 shows the target, score and expenditure for 2009 through 2011 for Guardrail. It also shows the amount budgeted for 2012 to be approximately $526,200 dollars and the performance target established for 2012 is an "A-".
Figure 55: Guardrail performance, expenditure.
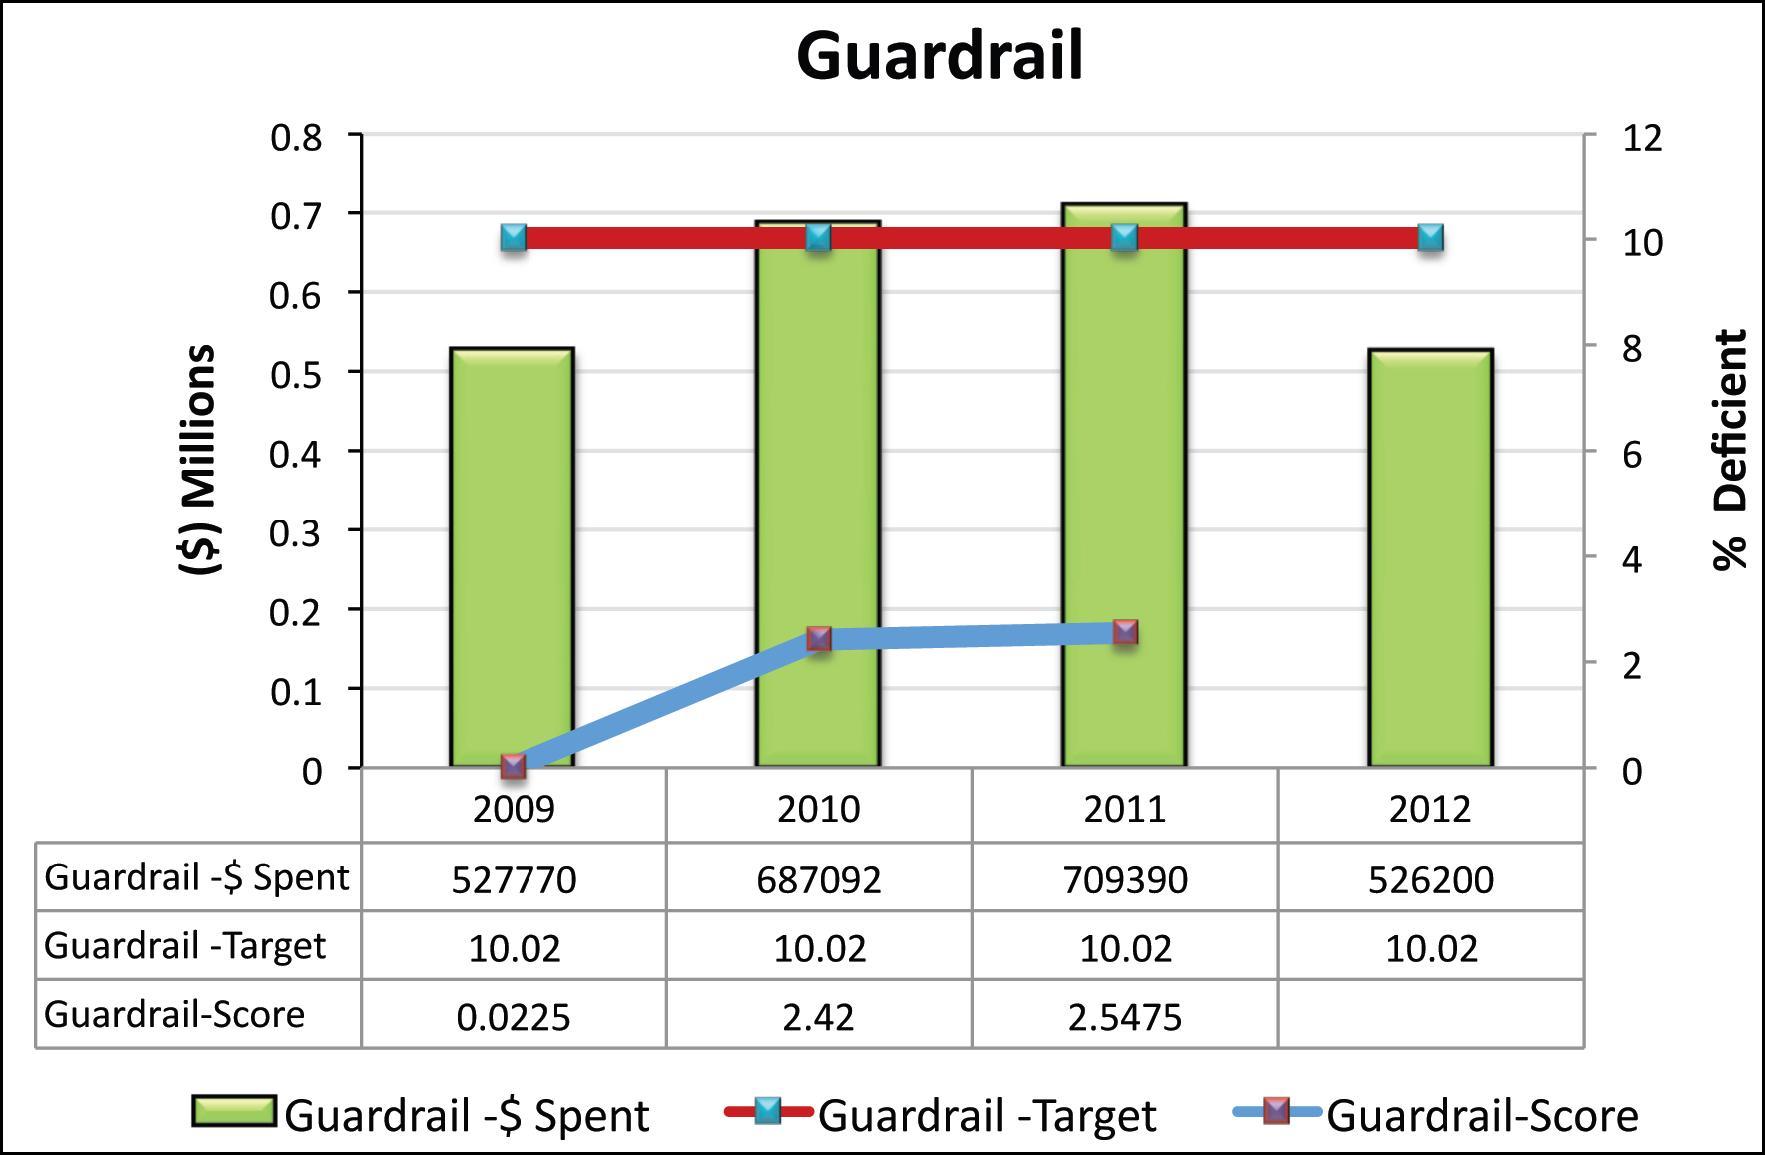
Figure 55 shows in red the performance target established for Guardrail for 2009 through 2012 and the expenditures in green through 2011 and the budget for 2012. Table 29 and Figure 55 show that in 2009 the agency spent $1,582,356 on guardrail and achieved an "A+", which exceeded its "A-" target. The next year, 2010, it decreased expenditure slightly and it again surpassed its condition target by scoring an "A+." The following year, it decreased expenditures further and again achieved an "A+." In 2012, it increased the budget slightly, closer to the levels of 2009.
This case study illustrates that a Maintenance Sustainability Ratio can be calculated with the data from a robust maintenance management system. However, the Utah example illustrates that some engineering judgment is needed to calibrate expenditure levels to reach targets unless the agency is completely satisfied with the accuracy of its inventory data, its condition assessments and its inspection process. The agency has devoted considerable effort to the continuous improvement of its inventories, its inspection consistency and to its budget estimates. All of these concerns directly affect the accuracy and usefulness of the Maintenance Sustainability Ratio. The accuracy of the MSR is dependent upon the accuracy and the reliability of the underlying data.
The Utah case study illustrates that using the MSR for specific assets in specific years must be done with judgment. This is because maintenance inventories are very large and are often incomplete. The conditions of assets such as shoulders or pavement markings can change rapidly. Also, a large number of personnel are involved in assessing conditions in the field, and this can lead to variability. All of these factors require that maintenance management systems and the production of an MSR will always remain a work in progress tempered by engineering judgment.
The example demonstrates that when the MSR is "rolled up" and looked at over a number of years it can be useful for long-term budgeting, programming and resource allocation. However, care must be used when assessing the accuracy of an MSR for a specific maintenance asset class that is subject to rapid changes in conditions.
The usefulness of the MSR will be more apparent in future years as UDOT continues its improvement of the maintenance management system. More complete inventory and condition data in the next few years will provide a much more robust Maintenance Sustainability Ratio for the State.
Inspection and reporting of the condition of features in the maintenance category involves reporting the condition and deficiency of a large range of transportation assets along the State maintained roadway. Much of the inspection is subjective and time consuming. The performance scores for each of the maintenance features also depend on the time of year when the inspection is being conducted and whether the inspection is done on a select sample. In the case of Pavement Striping, the condition of the sample that is selected for inspection will further influence the scores. It is also important to note that the score will depend on the total inventory of the asset that is recorded in the system.
It can take several years for the full 100 percent asset inventory to get updated in a system. As the inventory updated in the system gets close to 100 percent, the reports generated will become increasingly useful to decision makers in projecting budgets for future years. The expectation is that after a few years of implementation of the MMQA+ the entire maintenance inventory will get captured in the system. This will result in a more holistic reporting of condition of the overall system and its performance. As the historic budget and inventory information gets closer to reflecting the overall system conditions, the agency will find computation of MSR more useful for allocating future budgets as well as in moving budgets across categories.
Historically according to the DOT "budgeting for the maintenance program was an incremental process based on historical expenditures, plus a small increase for inflation." With the implementation of the MMQA+ the agency has now moved to a zero based budget. Each year's budget for the next year is projected based on system conditions, available budget and target of performance that is expected for the projected year. The goal of the agency is similar to the intent of the Maintenance Sustainability Ratio to "manage resources at all levels such that they are diverted towards activities that are falling short of their targets and away from activities whose targets are being exceeded."
The intent is that station supervisors can review the current conditions, established targets and available budgets in the MMQA+ and request money be moved across categories within their stations to effectively address focus areas/priorities to best meet established targets. The UDOT regional directors have the flexibility to move regionally allocated funds across various categories within stations and across stations within their region.
The agency uses the reports from MMQA+ to communicate with the legislature, the transportation commission and other key stakeholders. It also uses the information at a statewide level to develop budgets and establish targets for future years. A Quality Assurance (QA) process has been instituted for the MMQA+ program where each station has a QA check done once every year. Each station gets audited on either the monthly and bimonthly measures or on the full gamut of measures. The program is coordinated and conducted by the Central Maintenance area. With the training and the improvements taking place in the DOT in data collection and inspection, the agency will be able to realistically compute the MSR and also project the future budget needed to meet performance targets for future years.
The agency is continuing to look at all parameters that may need to be modified in order to get better projections for targeted level-of-maintenance and the cost associated with achieving the revised targets.
The following factors will have a bearing on the accuracy of the MSR and should be considered as examples of the types of issues that need to be addressed if developing an MSR.
Shoulder Work: Studying the data on Shoulder Work for 2009 through 2011 the MSR was above a 1.0. If one examined only the MSR data, it would indicate that the agency is spending more than the required budget to attain the goals established for each of the years. This would imply that the agency should reduce the budget for Shoulder Work. The agency reduced expenditures in 2011 and the number of deficiencies increased. For 2012, the agency increased shoulder work expenditures closer to the 2009 levels. This increase in budget reflects that the agency has shoulder work needs that are not reflected in the MMQA grade.
Pavement Striping: The analysis indicates that for 2009 the budget for Pavement Striping was about optimum as the agency met its target. However, in the next year with a similar budget the number of deficiencies doubled. The agency reduced expenditures slightly and yet scores slightly improved. The following year, 2012, the agencies increased the budget to a record amount.
While analyzing the data it is important to know that Pavement Striping is a "subjective measure of the observed condition of longitudinal markings on UDOT routes." The reporting is done semiannually. The measurement is taken on 1/10th mile sections of the highway on ten representative sections within the station boundary selected by the station supervisor. These factors were considered in setting the 2012 striping budget.
Pavement Markings: The analysis indicates an MSR greater than 1.0 in 2009, an MSR at 1.0 in 2010 and less than 1.0 in 2011. An MSR greater than 1.0 in 2009 would imply the 2010 budget could be reduced, which occurred. However, the number of deficiencies increased. When the budget was further reduced in 2011, the deficiencies increased further, resulting in a substantial budget increased in 2012 in an attempt to reduce deficiencies and achieve the target.
The agency takes into consideration, that similar to inspecting and scoring of Pavement Striping, Pavement Marking is also "a subjective measure of the observed condition of pavement messages on agency highways including word messages, crosswalks, stop bars, turn arrows, painted/taped medians, islands etc." The inspecting for reporting is done semiannually and the measurement area includes all messages on the agency maintained roadways. The manual provides detailed descriptions and examples of all markings that need to be counted. For example, the total messages on every route are taken and every marking lacking reflectivity, worn, not visible, faded or chipped is to be counted as a deficiency. For counting purposes, each letter, each arrowhead on a multi-headed arrow and each 2? X10? bar on a high visibility crosswalk is recorded. The total inventory, the time of inspection and the number inspected will influence the scoring received.
Signs and Posts: The data and analysis shows that in year 2009 the MSR is greater than 1.0 indicating that the agency has put more money than necessary into this maintenance category to achieve the target score. In 2009, the agency exceeded the required target. In 2010 the agency budget was decreased. For 2010 the Signs and Posts category has the optimum MSR of 1.0 and the agency achieved its target score of an "A-". The 2010 scenario shows that the agency decreased its budget to the amount necessary to achieve the established target performance. In 2011, the score achieved was a "B+" which is very close to the target established of an "A-". In 2012 the agency has marginally increased the budget to achieve the target score of "A-" for 2012.
Signs and Posts are inspected and reported bimonthly. It is a "measure of the observed condition of sign installations along the agency?s highways." The measurement area includes all agency maintained roadways/roadsides. The total number of sign installations for each route or route segment is to be recorded and the number of sign installations that do not meet the standard is to be counted and recorded. A detailed description of deficiency is included in the manual. For example, signs are classified as deficient for insufficient retro-reflectivity, worn or missing characters in message, incorrect sign height, incorrect lateral clearance, missing hardware, and broken posts.
Guardrail: The analysis of data in this category indicates that in all three years (2009, 2010 and 2011) the agency has scored an "A+" which is higher than the target score of "A-". The data indicates that the agency has an MSR slightly greater than 1.0. It would indicate that the agency is assigning above-optimum amounts in this maintenance category, however, guardrail condition is important to achieving the safety goal of the agency. Guardrail inspection involves "measuring the condition of guardrail, concrete barriers and cable barriers on State routes." Deficient condition includes panels being damaged, leaning, or bent, broken posts, offset blocks, missing panel and connection hardware, or sagging guardrail sections or cable runs. The reporting for this category is semiannual. The measurement area includes all agency maintained roadways/roadsides. The measure of total guardrail is the entire length in feet of barrier, guardrail and cable barrier along the route. UDOT has a strong emphasis on all categories of safety which is reflected in its budgeting.
The scores, targets and budgeted amounts from the five areas of UDOT?s maintenance activities as well as the QA process instituted by the agency provide some valuable insight into the usefulness of the Maintenance Sustainability Ratio in establishing needs and budgets for future years. They also provide good examples of how MSR can be used to communicate with key stakeholders the agency?s logical approach to computing budget needs and optimizing funds to meet infrastructure maintenance needs. Besides computing the MSR, steps that might be helpful include the following:
The definition of what constitutes "maintenance" has varied between the individual States examined in this report. As noted in Chapter 1, this report does not try to impose one definition of maintenance. Instead, the case studies illustrate how three different States calculate maintenance needs and conditions, and therefore could calculate a Maintenance Sustainability Ratio to meet their own needs.
Ohio's maintenance management system has evolved, but for the sake of this report, sample data from 2002 through 2007 are used. This particular data was readily available and did not require the Ohio Department of Transportation to produce ad hoc reports to supply new data to test the concept of a maintenance sustainability ratio. It should be noted the Ohio DOT has changed its maintenance measurements from those illustrated in this report but the data used in this example illustrate that maintenance sustainability ratios can be produced using data commonly available from States' maintenance management systems.
For nearly a decade, the department emphasized eight major categories of roadway maintenance attributes for the maintenance performance system. They were:
In this report, the litter data are not examined. The department emphasized other important maintenance functions as well such as snow and ice control, crack sealing, traffic signal maintenance and other common activities. However, the seven features noted in this section represent common activities for which performance targets were set and expenditures could be compared to the achieved targets.
Ohio's maintenance management process differed from some other States' in that it did not use a commercial maintenance management system. It used a team of internal raters who drove 100 percent of the highway system each year and used geographical positioning system (GPS) and linear referencing technology to document each observed maintenance deficiency in the eight roadway categories listed above. Through the use of touch screen technology, (Figure 56, below) the raters would log from a menu the deficiencies observed at a given location. Those deficiencies were recorded and they were logged into geo-spatially referenced mapping and tabulated numerically. With this process, the number of deficiencies observed each year could be tabulated and the deficiencies' locations could be mapped. The mapping and tabulations were used by both central office and district personnel to set maintenance priorities, track accomplishments and record progress. As seen in Figure 57 below, the mapping provided locations for maintenance personnel where the observed deficiencies were found.
Figure 56: Touch screen menu of deficiencies.
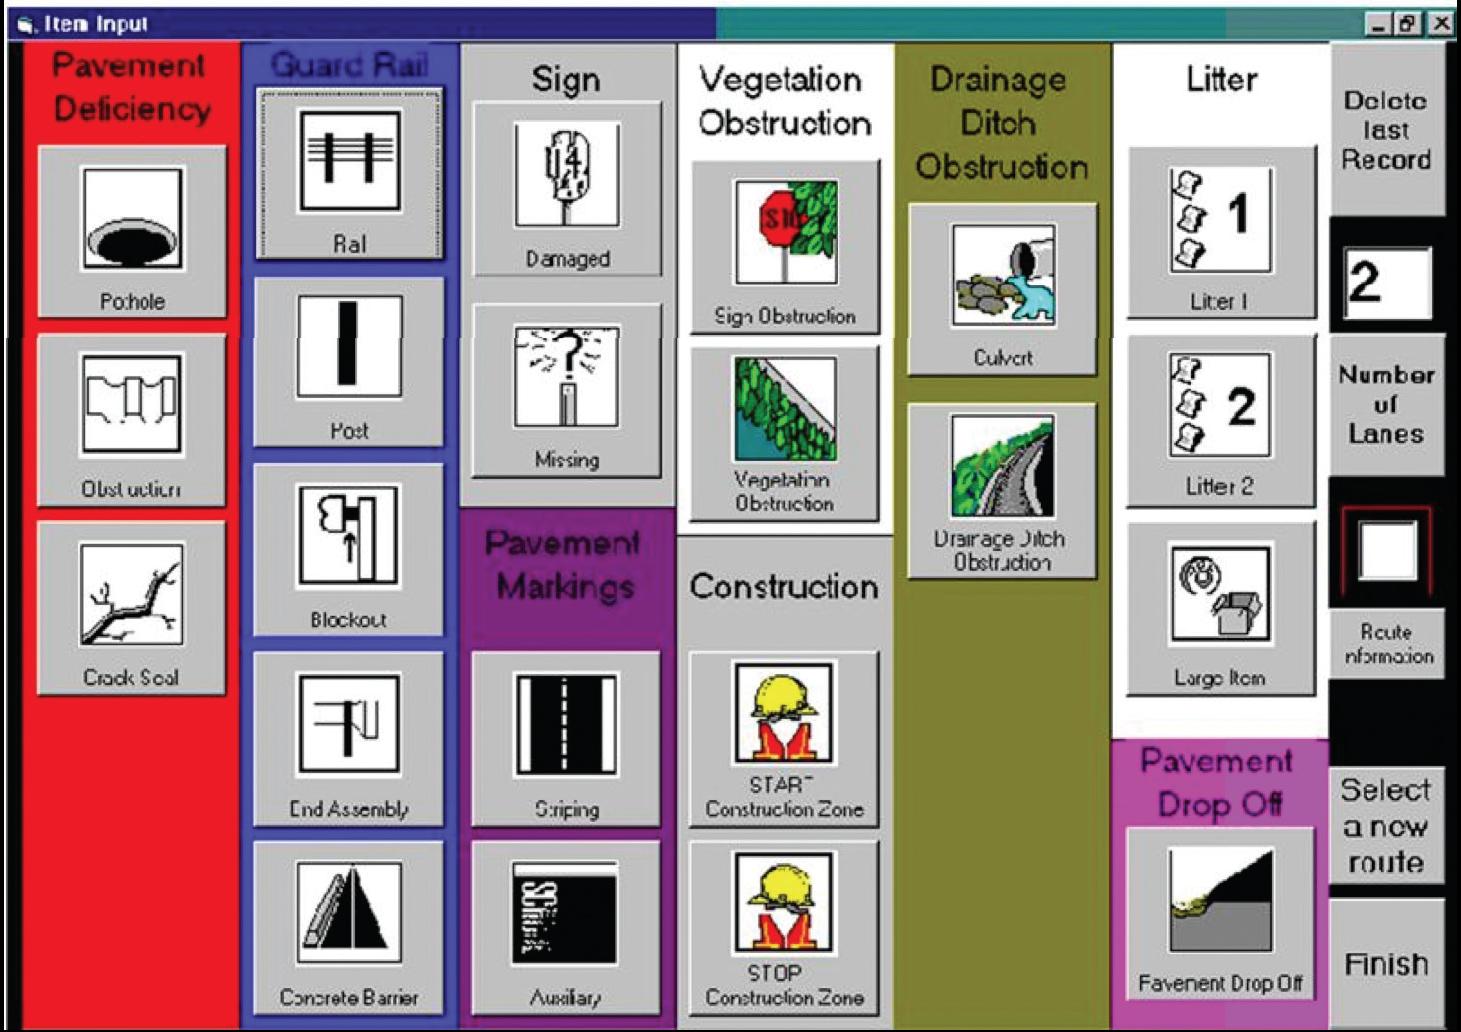
Figure 57: Map of maintenance deficiencies in one county quadrant.
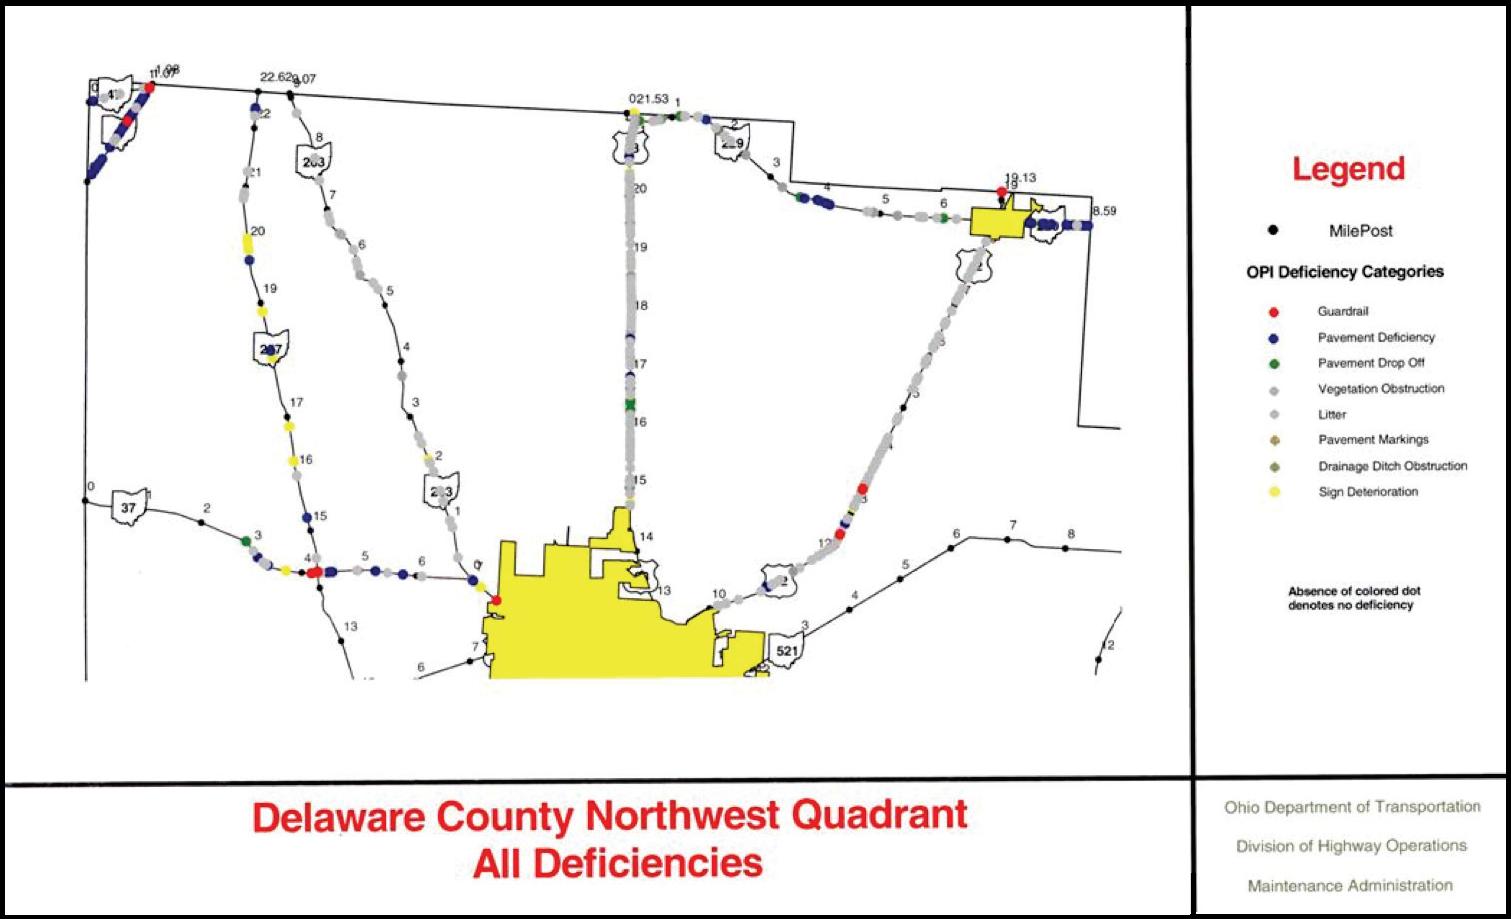
Also a seen in Figure 57, these deficiencies are for one quadrant of one county. Each quarter, one fourth of the State system was mapped, providing 100 percent coverage over the course of each year.
Targets were set for each maintenance condition. Each individual category had its own number of deficiencies per mile that were considered acceptable and its own definition of what constituted a deficiency. For instance for shoulder drop offs, a difference of four or more inches between the pavement surface and shoulder for more than 20 feet was deemed a deficiency. A guardrail deficiency could be a rotted block or post, a damaged rail or a rail that was too high or low. Different scales of acceptable number of deficiencies were set. Generally, a lower number of deficiencies were tolerated for the Priority System and a higher number for the General System.
Ohio had, in effect, two scales. One very generalized scale was on a 1-6 gradient for the ODOT's Organizational Performance Index (OPI). The OPIs provided a common series of metrics to compare more than 60 performance categories Department-wide. Within each maintenance category, thresholds were set for gradients of scores that could be translated into the more simplistic scale of 6 being the highest and 1 the lowest.
Each district controlled a budget that allowed it to prioritize its employee labor hours, its equipment usage and maintenance contract dollars. The maintenance dollars could be used to buy materials, let small maintenance contracts, rent equipment or take other actions to augment internal resources to achieve the maintenance targets. The districts and each individual county produced an annual Work Plan that allocated the labor, equipment, materials and contracts to specific maintenance target categories. The Work Plan format was intended to match resources with results and allow the process to determine over time how many resources were needed to sustain the targeted maintenance conditions. When the process first began in the early 2000s, it was not known how many resources would be needed to sustain the targeted maintenance conditions across the State. Gradually, over the years, the needed level of effort was more closely estimated but it was still affected by unpredictable events such as flooding, harsh winters or other events.
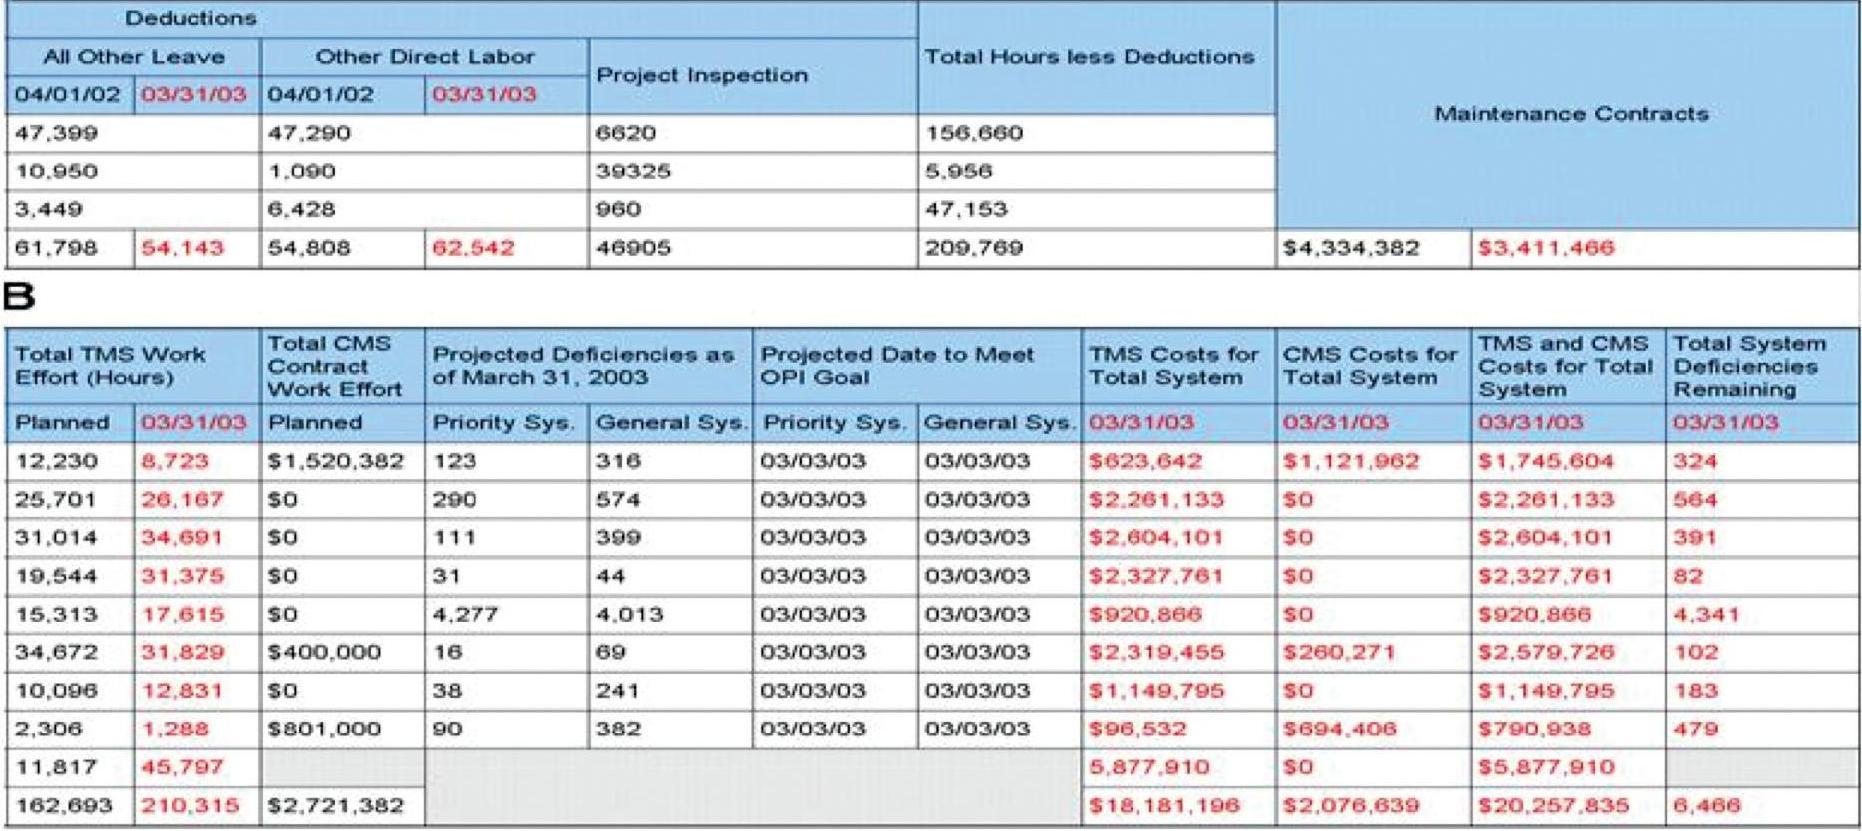
As seen in Figures 58 and 59 the total number of deficiencies would be tracked in the Work Plan as well as the level of effort devoted to addressing the deficiencies in terms of labor hours and contract work. In Figure 58 and 59, TMS refers to the Transportation Management System that tracked the hours of maintenance personnel. The internal labor hours in TMS and the external contract dollars tracked through the Construction Management System (CMS) provided the total level of effort devoted to addressing the maintenance deficiencies.
Figure 58: A county work plan shows condition, level of effort.
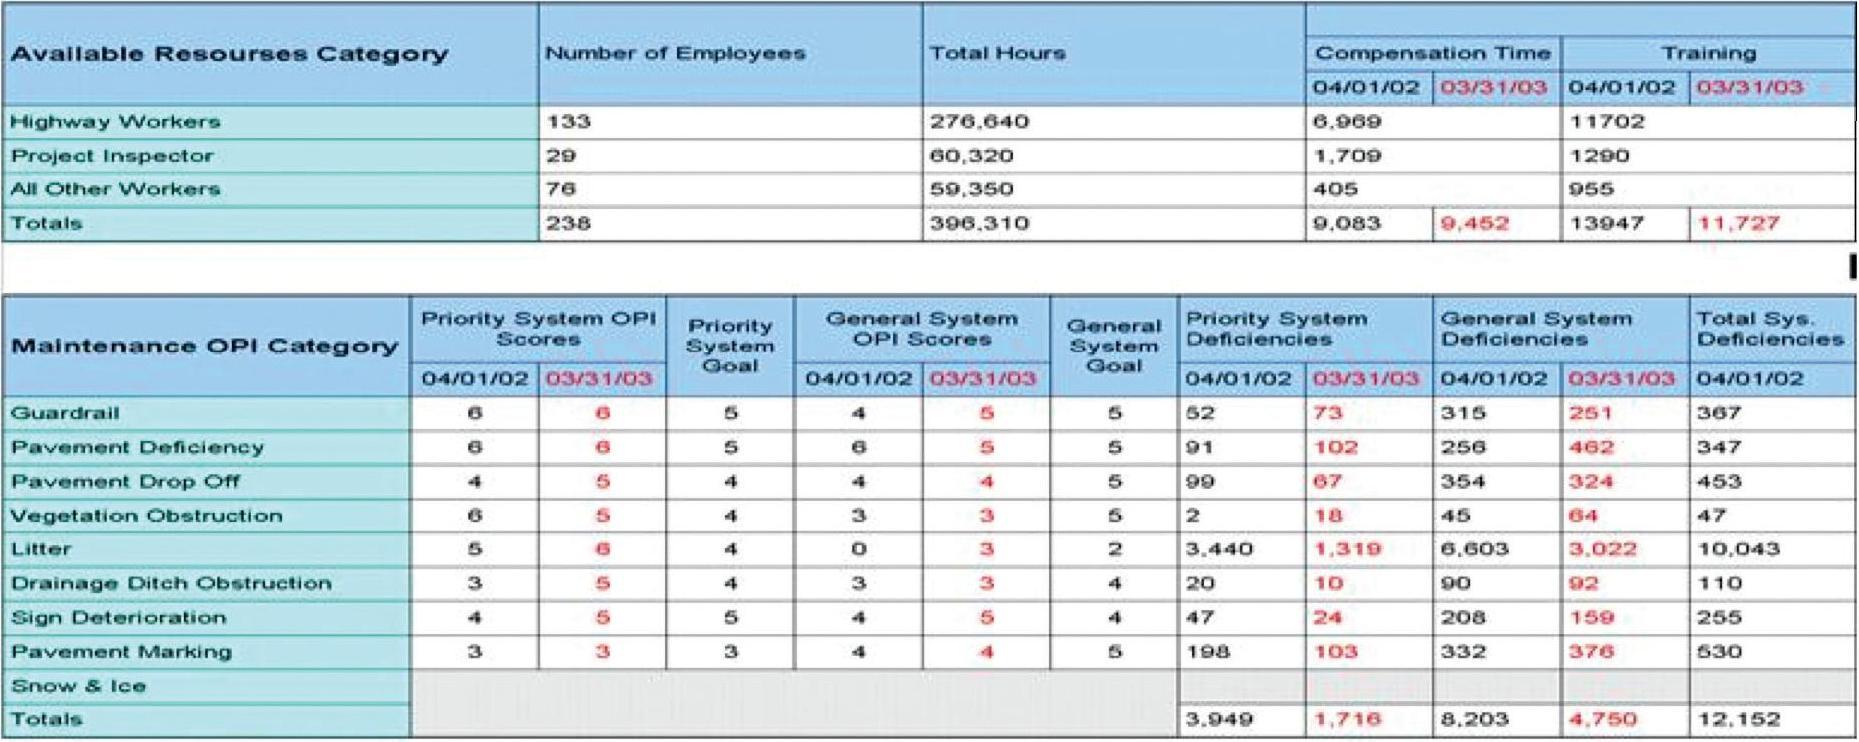
Figure 59: A county work plan's anticipated level of effort by category of deficiency.
This section examines a few selected examples of Ohio's maintenance expenditure and compare them to the needed level of investment to illustrate that sustainability ratios could be calculated with the Ohio system, and the data it produces.
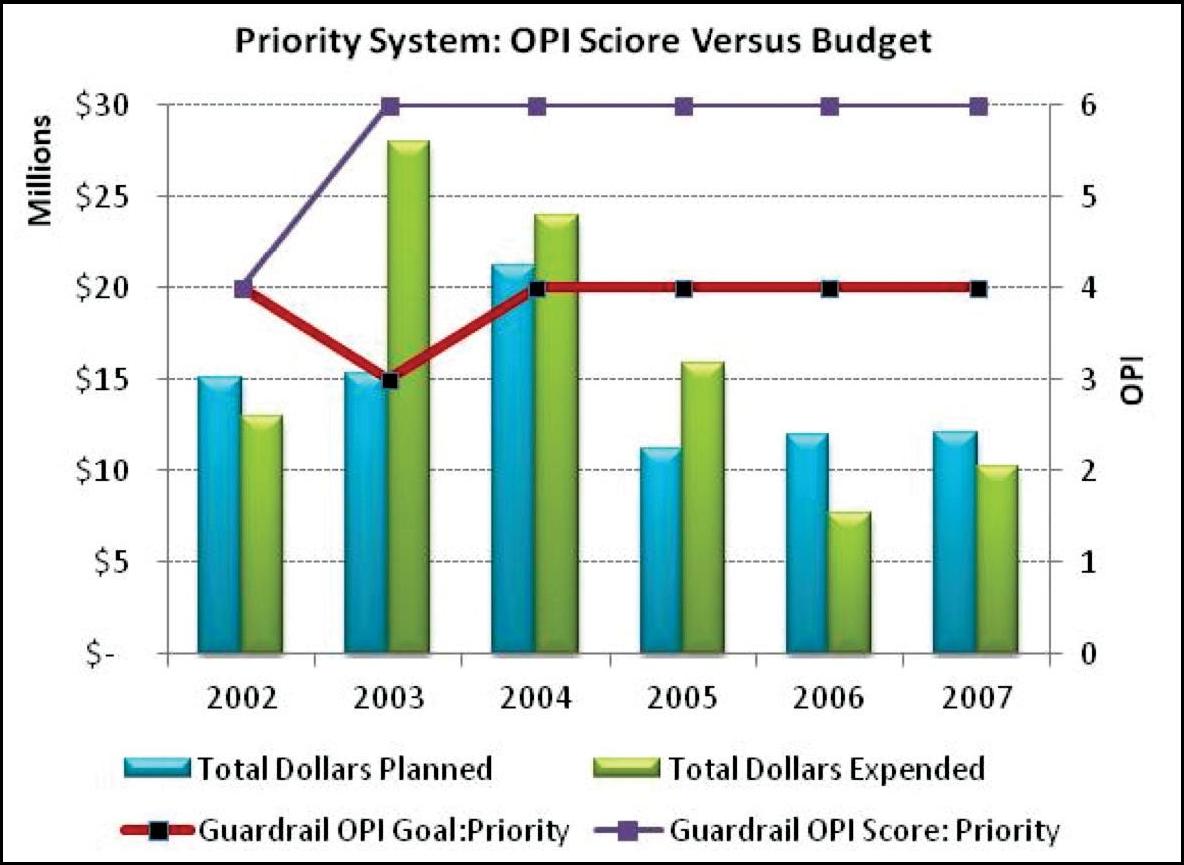
In Table 30, the expenditures and conditions related to guardrail are shown for the period 2002 through 2007. As can be seen, the guardrail conditions met or exceeded the established target for each year of the period. The actual amount "needed" for guardrail that would serve as the denominator is imprecise in these examples because the precise definition of "need" was not determined at the time by ODOT. However, it is apparent from the expenditures and the resulting conditions those expenditures achieved that ODOT was meeting and sustaining its guardrail conditions. In fact, ODOT consistently exceeded its guardrail minimum goal by investing to achieve its highest score, a 6, on its Organizational Performance Index. The higher expenditures were left as matter of judgment for each district, and most, routinely exceeded the minimum threshold targets.
| Ohio Guardrail Expenditures and Results | ||||||
|---|---|---|---|---|---|---|
| Goal Priority System | Score Priority System | Goal General System | Score General System | Total Dollars Planned | Total Dollars Expended | |
| 2002 | 4 | 4 | 4 | 4 | $15,158,160 | $13,033,940 |
| 2003 | 3 | 6 | 4 | 5 | $15,305,939 | $27,997,339 |
| 2004 | 4 | 6 | 4 | 6 | $21,196,440 | $24,016,952 |
| 2005 | 4 | 6 | 4 | 6 | $11,270,815 | $15,884,488 |
| 2006 | 4 | 6 | 4 | 6 | $11,970,358 | $7,637,011 |
| 2007 | 4 | 6 | 4 | 6 | $12,143,049 | $10,186,560 |
| $87,044,761 | $98,756,290 | |||||
Figure 60 illustrates the trends and expenditures graphically. It assumes that the "total dollars planned" equates to the "needed" amount that would serve as the denominator in a sustainability ratio. With that assumption, Figure 60 illustrates that while a $15.1 million expenditure would achieve the minimum goal of an OPI score of 4, ODOT overspent that minimum and achieved higher results. Guardrail consistently improved, rising from scores of 4 to scores of 6 for both the Priority and the General System.
Figure 60: Ohio guardrail expenditures and conditions.
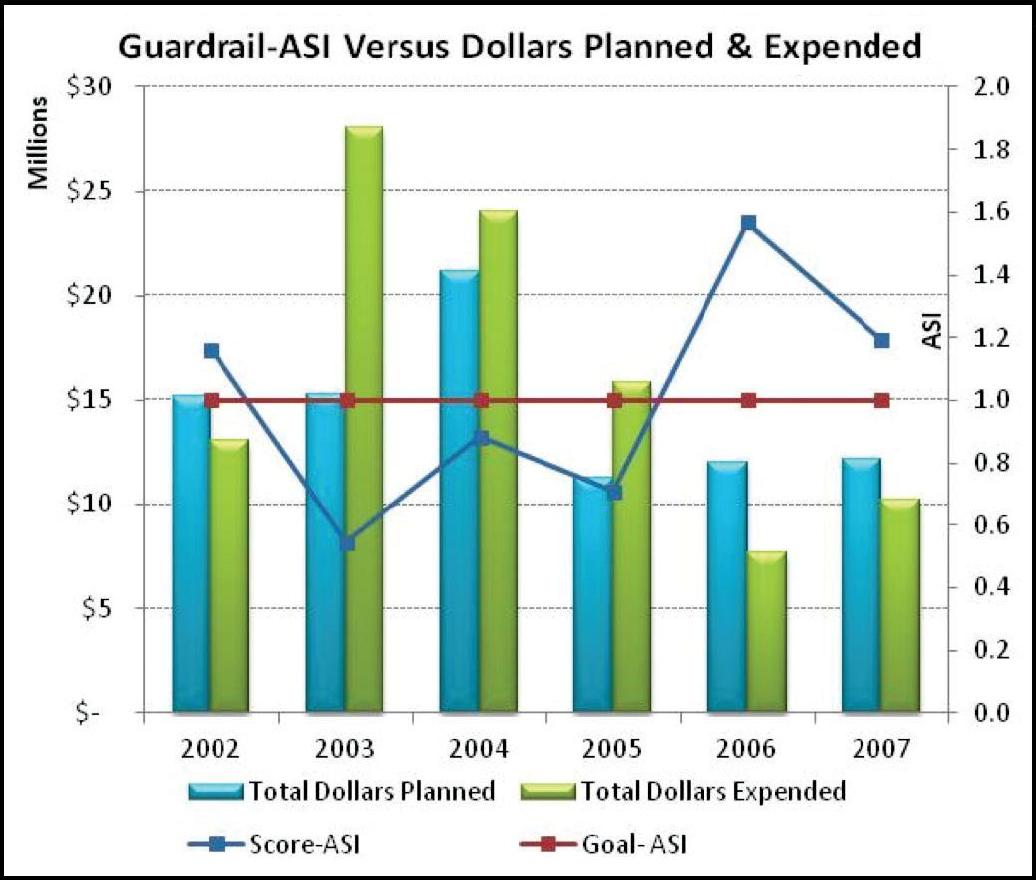
As also can be seen, the overall expenditures were reduced after 2004 and ODOT still maintained it highest score of 6. As seen in other examples, the process of accurately forecasting level of effort and budget for maintenance activities often takes several years. It appears that the department and its districts were learning to calibrate the level of effort to sustain the high standards, after an initial surge in investment to clear up backlogs of deficiencies and to achieve the highest OPI scores. Investment fell from a high of nearly $28 million in 2003 down to $10.1 million in 2007 yet the guardrail scores remained high, and well above the minimum goal.
Figure 61: General system guardrail conditions, budgets.
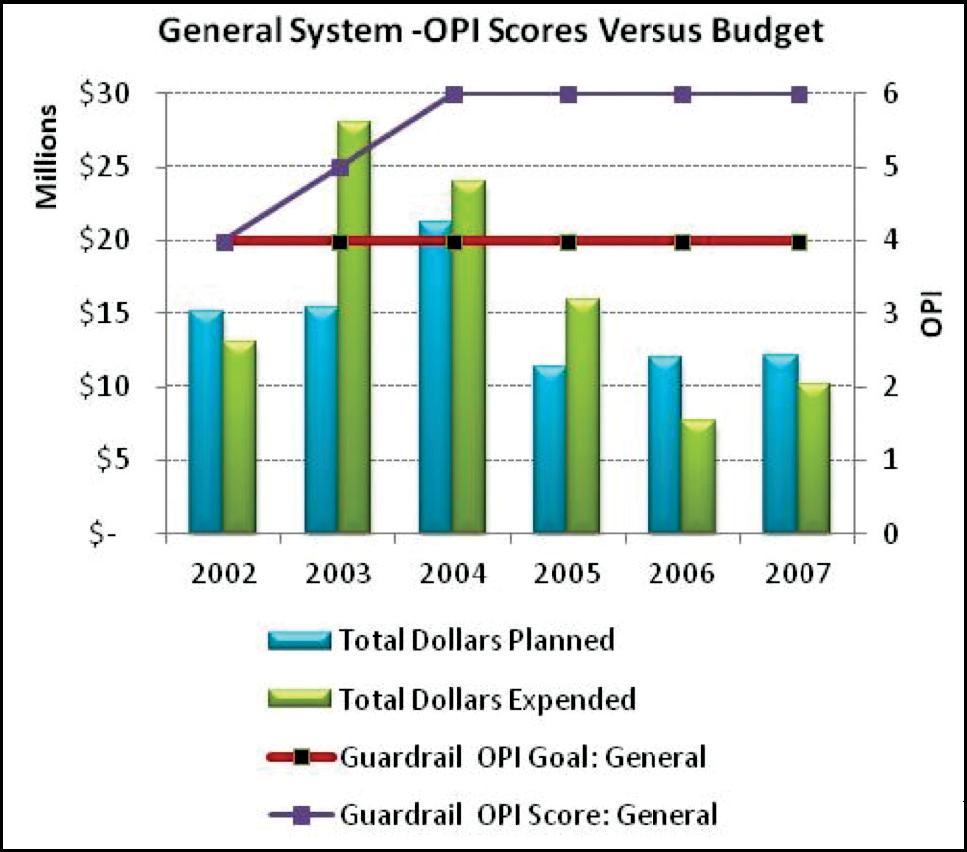
Figure 62: Guardrail Work-Score, Target and Expenditure.
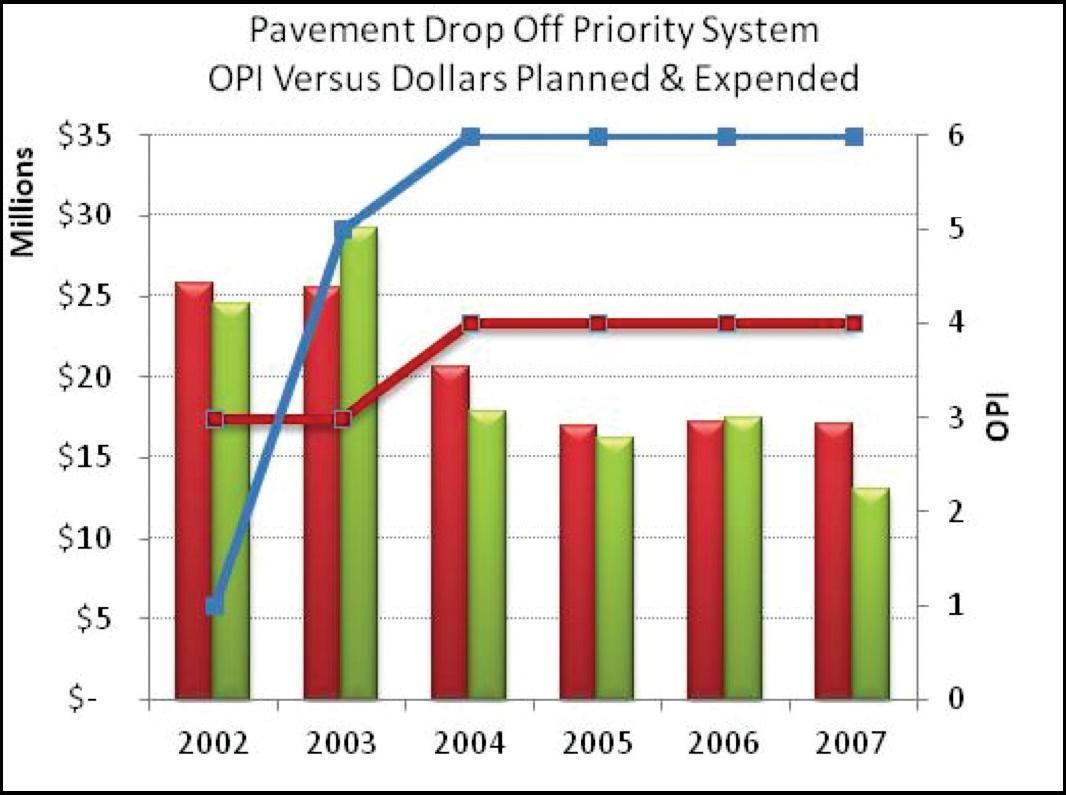
Similar calibration could be seen over time in the category of shoulder drop offs.
| Ohio Shoulder Drop Off Expenditures and Results | ||||||
|---|---|---|---|---|---|---|
| Goal-Priority | Score-Priority | Goal-General | Score-General | Total Planned $ | Total Expended $ | |
| 2002 | 3 | 1 | 3 | 3 | $25,797,874 | $24,522,219 |
| 2003 | 3 | 5 | 3 | 5 | $25,473,871 | $29,190,764 |
| 2004 | 4 | 6 | 4 | 6 | $20,652,394 | $17,846,365 |
| 2005 | 4 | 6 | 4 | 6 | $16,910,752 | $16,230,485 |
| 2006 | 4 | 6 | 4 | 6 | $17,140,249 | $17,402,526 |
| 2007 | 4 | 6 | 4 | 6 | $7,019,441 | $12,980,742 |
As seen in Table 31 and Figure 63, the 2002 score for shoulder drop offs on the Priority System was far below target and for the General System the scores only met the minimum goal of 3. The level of effort was boosted in 2003 with a commensurate rise in shoulder drop off scores on both the Priority and General System. Again, the trend could be seen where following the initial addressing of backlogs, the expenditures on sustaining the conditions steadily fell while retaining the higher scores. As seen in 2007, the scores were higher than the targets when the expenditures were higher than the planned budget. This could also be the result of additional effort required to repair shoulders after particularly heavy rains.
Figure 63: Shoulder drop off condition, budgets.
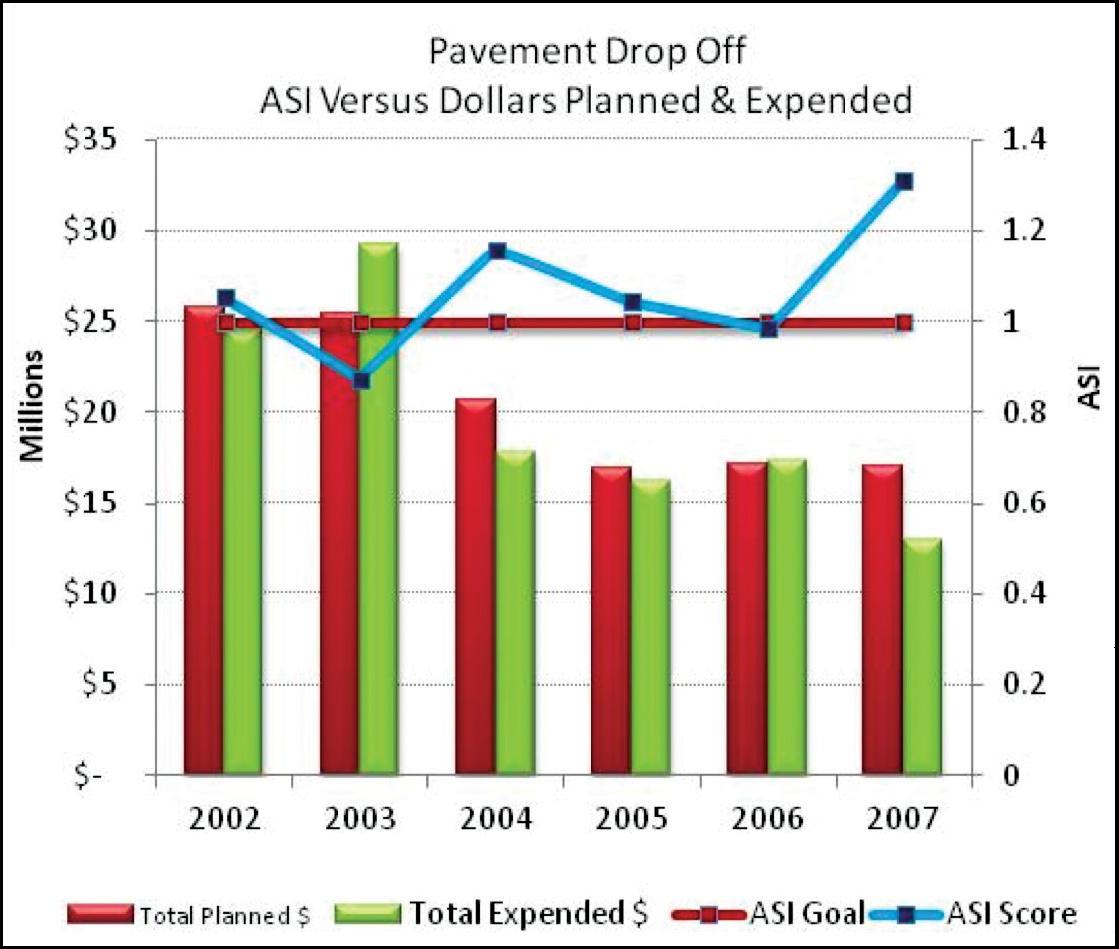
Figure 64: Drop off conditions, expenditures on Priority System.
The data for the other seven Ohio maintenance categories are not illustrated here in the interest of brevity. The two examples of guardrail and shoulder drop offs illustrate that for the Ohio maintenance categories the level of effort necessary to sustain maintenance conditions can be estimated and compared to the actual expenditures to produce maintenance-specific sustainability ratios. The Ohio example also illustrates that the generation of the maintenance ratios is possible without using a commercial maintenance management system software package. In other words, the generation of the maintenance sustainability ratio is possible using several methods and allows flexibility regardless of the State's maintenance management process.
In Ohio's case, the seven categories of maintenance expenditures could be "rolled up" into one composite index that allows for reasonable budgeting certainty that a given level of investment should sustain maintenance conditions indefinitely over the long term. As with the Utah DOT example, however, the Ohio case study illustrates in any given year the needed level of investment by maintenance category may need to exceed the planned amount for several reasons. Flooding, geologic conditions or other events can significantly affect maintenance items such as drainage, shoulder drop offs or even guardrail. As the Utah case study illustrated, the use of a sustainability ratio for maintenance provides long-term insight into needed expenditure levels but it also needs to be augmented with engineering judgment as conditions change based upon in-the-field observations. In the early years of establishing maintenance targets, the actual field conditions and the needed level of investment may not be precise and may need to be calibrated over several years. Likewise, severe weather or other events can cause annual fluctuations in both conditions and in needed expenditures. However, when viewed over a several year period as shown in the Ohio example, the sustainability ratios can augment decision making and can help illustrate how investment levels compare to the optimized investment levels necessary to sustain maintenance conditions over the long term.
The North Carolina Department of Transportation (NCDOT) uses its Maintenance Management Systems to forecast detailed estimates of the levels of capital and labor necessary to sustain its roadway maintenance conditions. With these estimates, it produces forecasts that are similar to Maintenance Sustainability Ratios and which illustrate the necessary level of effort to sustain maintenance conditions over time.
The NCDOT manages the maintenance activities on a large, sprawling and growing highway network. It manages 79,185 miles of highways, far more than is handled by the average department. Because it manages the local highway network, its span of responsibility is disproportionately large.
NCDOT relies on a mature maintenance management system to help it address the thousands of maintenance condition items for which it is responsible. It has developed targets for 18 major maintenance categories and it measures conditions, activities and budgets for many other maintenance categories that do not lend themselves to targets. Its maintenance management process involves inspecting a statistically valid sample of roadways and measuring the conditions. From those measurements, it calculates the numbers of deficiencies and calculates a level of effort to bring them to targeted levels.
"Maintenance" in the NCDOT vocabulary includes minor pavement and bridge repair and preservation activities, treatment of drainage and culverts, maintaining roadside items such as guardrail and cable barrier, mowing, litter, pavement markings, traffic control devices and other such activities and features. Its maintenance definition is considerably broader than those of Ohio and Utah.
NCDOT's annual Maintenance Condition Assessment Report (MCAP) provides the General Assembly and public an assessment of the condition of the highway infrastructure and an estimate of the funding needed to meet and sustain its maintenance targets.
Table 32 is an information-rich summary of the categories of maintenance items tracked, their conditions, and a breakdown of whether the conditions met the targets by three highway systems, the Interstate, Primary and Secondary. As can be seen, four major maintenance categories are tracked, drainage, roadside, traffic and bridge. Within each category, between four and six categories of items are measured.
| Roadway Conditions | Interstate | Primary | Secondary | |||||
|---|---|---|---|---|---|---|---|---|
| 2010 | State Average | 2010 | State Average | 2010 | State Average | |||
| Performance Measures | Target | Score | Target | Score | Target | Score | ||
| Drainage | Unpaved Shoulders | No dropoffs greater than 3 inches and no shoulders higher than 2 inches | 95 | 91 | 90 | 89 | 85 | 91 |
| Ditches (Lateral Ditches) | No blocked, eroded or non-functioning ditches | 95 | 98 | 90 | 94 | 85 | 94 | |
| Crossline Pipe (Blocked) | Greater than 50% diameter open | 95 | 87 | 90 | 78 | 85 | 74 | |
| Crossline Pipe (Damaged) | No damage or structural deficiency affecting functionality | 95 | 93 | 90 | 95 | 85 | 91 | |
| Curb & Cutter (Blocked) | No obstructure greater than 2 inches for 2 feet | 95 | 97 | 90 | 96 | 85 | 96 | |
| Boxes (Blocked or Damanged) | Grates and outlet pipe conditions | 95 | 82 | 90 | 87 | 85 | 85 | |
| Roadside | Vegetation (Brush & Tree) | Freeways, 45 feet from travelway; 5 feet behind guardrail. Not blocking signs. Non-freeways 15 feet over roadway and 10 feet back of ditch centerline or shoulder point | 90 | 90 | 85 | 85 | 80 | 80 |
| Vegetation (Turf Condition) | Areas free of erosion | 95 | 84 | 90 | 83 | 85 | 86 | |
| Stormwater Devices | Functioning as designed | 90 | 94 | 90 | 94 | 90 | 94 | |
| Landscape Plant Beds | Achieving score of 2 or higher on inspection form | 90 | 90 | 80 | 90 | N/A | N/A | |
| Rest Areas & Welcome Centers | Condition rating of 90 | 90 | 96 | 90 | 95 | N/A | N/A | |
| Traffic | Long Line Pavement Markings | Present, visible | 90 | 93 | 85 | 90 | 80 | 81 |
| Words and Symbols | Present, visible | 90 | 73 | 85 | 85 | 80 | 77 | |
| Pavement Markers | Present and reflective | 90 | 84 | 85 | 59 | N/A | N/A | |
| Ground Mounted Signs | Visible and legible | 90 | 94 | 85 | 91 | 85 | 85 | |
| Overhead Signs | Visible and legible | 90 | 93 | 85 | 80 | 85 | 100 | |
| Bridge | NBIS Culverts | Condition Rating >=6 | 85 | 86 | 85 | 86 | 85 | 89 |
| Non-NBIS Culverts | Condition Rating = Good | 80 | 84 | 80 | 74 | 80 | 56 | |
| Overhead Sign Structures | Condition Rating = Good | 95 | 95 | 95 | 93 | 95 | 88 | |
| Totals | 91.27 | 89.79 | 87.28 | 86.04 | 84.49 | 85.04 | ||
Table 33 below presents a summary of the targets, conditions, expenditures and needs for major maintenance items on the NC Interstate Highway system. Table 33 includes more maintenance items than does Table 32 because it includes items for which a target has not been set. NCDOT's maintenance management system tracks the level of expenditure inclusive of labor, equipment, materials and other costs. It illustrates the level of effort expended for each item, and an estimate of the level of effort needed to achieve the target. From the two, a Maintenance Sustainability Ratio can be calculated for each item, for each year, as shown in the far right column of Table 33.
Although Table 33 illustrates only the Interstate Highway System, similar analyses are conducted for the Primary and the Secondary System. Such analysis provides a high degree of granularity for the highway network, by maintenance category, or even district.
| Interstate Highway Element | 2010 | State Average | FY 2010 | Funding Required to attain and maintain LOS | Expenditure by Category | Need by Category | Ratio by Category | ||
|---|---|---|---|---|---|---|---|---|---|
| TARGET | Score | Expenditure | |||||||
| SHLD/ DITCH | RM-1 | High/Low Shoulder | 95 | 91 | $1,190,679 | $2,237,430 | $1,468,462 | $2,515,213 | 0.584 |
| RM-2 | Lateral Ditches | 95 | 98 | $277,783 | $277,783 | ||||
| DRAINAGE | RM-3 | Crossline Pipe (Blocked) < 54 | 95 | 87 | $17,065 | $48,449 | $942,691 | $3,767,723 | 0.250 |
| RM-4 | Crossline Pipe (Damaged) < 54 | 95 | 93 | $39,699 | $56,774 | ||||
| RM-5 | Curb & Gutter (Blocked) | 95 | 97 | $601,328 | $601,328 | ||||
| RM-6 | Drop Inlets, CB's, etc (Blkd/Damaged) | 98 | 82 | $284,599 | $3,061,171 | ||||
| ROADSIDE APPURT | Guardrail/Cable/Median Barrier/Conc | Not Rated | $1,543,609 | $1,543,609 | $1,795,609 | $1,795,609 | 1.000 | ||
| ROW Fence | Not Rated | $246,836 | $246,836 | ||||||
| Impact Attenuators | Not Rated | $5,165 | $5,165 | ||||||
| ROADSIDE | R-1 | Brush & Tree Control | 90 | 90 | $4,305,375 | $4,305,375 | $10,807,951 | $14,093,842 | 0.767 |
| R-2 | Turf Condition | 95 | 84 | $553,791 | $2,004,194 | ||||
| R-3 | Stormwater Devices (NPDES) | 90 | 90 | $5,933 | $5,933 | ||||
| Uncontrolled Growth | Not Rated | $1,050,224 | $1,050,224 | ||||||
| Mowing | Not Rated | $2,861,847 | $2,861,847 | ||||||
| Litter & Debris Control | Not Rated | $2,030,780 | $3,866,268 | ||||||
| TRAFFIC | T-1 | Long line pavement markings | 90 | 93 | $301,387 | $301,387 | $1,721,914 | $1,885,077 | 0.913 |
| T-2 | Words % Symbols | 90 | 73 | $46,533 | $154,897 | ||||
| T-3 | Pavement Markers | 90 | 84 | $76,718 | $131,516 | ||||
| T-4 | Signs ground | 90 | 94 | $1,236,758 | $1,236,758 | ||||
| T-5 | Overhead Signs | 92 | 93 | $60,518 | $60,518 | ||||
| PVMT | P-2 | Asphalt pavement repair | 95 | 89 | $1,225,568 | $2,872,142 | $1,420,011 | $3,066,585 | 0.463 |
| P-3 | Concrete pavement repair | 95 | Not Rated | $194,443 | $194,443 | ||||
| TOTALS | $18,156,639 | $27,124,049 | $18,156,639 | $27,124,049 | 0.669 | ||||
The total maintenance needs are "rolled up" into estimates as shown in Table 34. It illustrates the forecasts of financial needs to meet maintenance targets for seven years. From this forecast, a Maintenance Sustainability Ratio can be calculated once budget amounts are approved for each of the seven years. Future budgets are not yet approved.
| Performance Based Activities | 2011-12 | 2012-13 | 2013-14 | 2014-15 | 2015-16 | 2016-17 | 2017-18 |
|---|---|---|---|---|---|---|---|
| Pavements | $299.03 | $311.59 | $324.68 | $338.31 | $352.52 | $367.33 | $382.76 |
| Shoulders & Ditches | $63.19 | $65.84 | $68.61 | $71.49 | $74.49 | $77.62 | $80.88 |
| Drainage | $39.13 | $40.77 | $42.49 | $44.27 | $46.13 | $48.07 | $50.09 |
| Roadside Appurtances | $9.23 | $9.62 | $10.02 | $10.44 | $10.88 | $11.34 | $11.81 |
| Traffic Control Devices | $40.08 | $41.76 | $43.52 | $45.35 | $47.25 | $49.23 | $51.30 |
| Roadside/Environmental | $103.01 | $107.34 | $111.84 | $116.54 | $121.44 | $126.54 | $131.85 |
| Rest Area/Welcome Center Maint | $11.70 | $12.19 | $12.70 | $13.24 | $13.79 | $14.37 | $14.98 |
| Plant Bed Maintenance | $5.07 | $5.28 | $5.50 | $5.74 | $5.98 | $6.23 | $6.49 |
| Total | $570.44 | $594.40 | $619.36 | $645.38 | $672.48 | $700.73 | $730.16 |
The maintenance analysis above is part of a larger North Carolina asset management reporting process that also includes pavement and bridges. The reports provide quantitative and qualitative descriptions of the system including:
Three comprehensive surveys are used to evaluate the condition of the highway system, a Maintenance Condition Survey, a Bridge Condition Survey and a Pavement Condition Survey. In keeping with the legislative requirements, NCDOT estimates the cost to meet and sustain these performance standards and it forecasts the optimal funding needed for the seven year period.
For instance, it notes that the annual cost to meet the roadway maintenance performance standards is $668.47 million. The cost to meet the bridge performance standards is $71.65 million and to perform necessary bridge preservation functions is an additional $26.24 million. The cost to operate the State's traffic signals and Intelligent Transportation System (ITS) devices is $74.49 million. The annual cost for routine and interstate pavement preservation activities is $207 million and resurfacing is an additional $330 million annually.
These projected investment needs are totaled, after some adjustments for non-traditional funds, to create total maintenance funding needs for fiscal year 2011-2012 of $1.26385 billion. This need is in contrast to an estimated allocation of $933 million. Superficially, this analysis provides the initial inputs for an Asset Sustainability Index of:
| $933 $1,264 |
= 73.8 |
In other words, approximately 74 percent of the investment necessary for long-term sustainability of the network is provided. Although the NCDOT report does not produce an actual ASI, its narrative and its interpretation provide policy makers with the bottom line of the long-term consequences. "North Carolina stands at a crossroads of funding and system condition. The Department recognizes that as funding has remained constant system condition decreases, possibly jeopardizing the safety and mobility of North Carolina's citizens. A comprehensive, balanced funding program of maintenance preservation, rehabilitation and replacement is necessary to operate and maintain the highway system at an acceptable level."
Additional forecasts provided by the NCDOT report illustrate the future system consequences if the current investment levels continue.
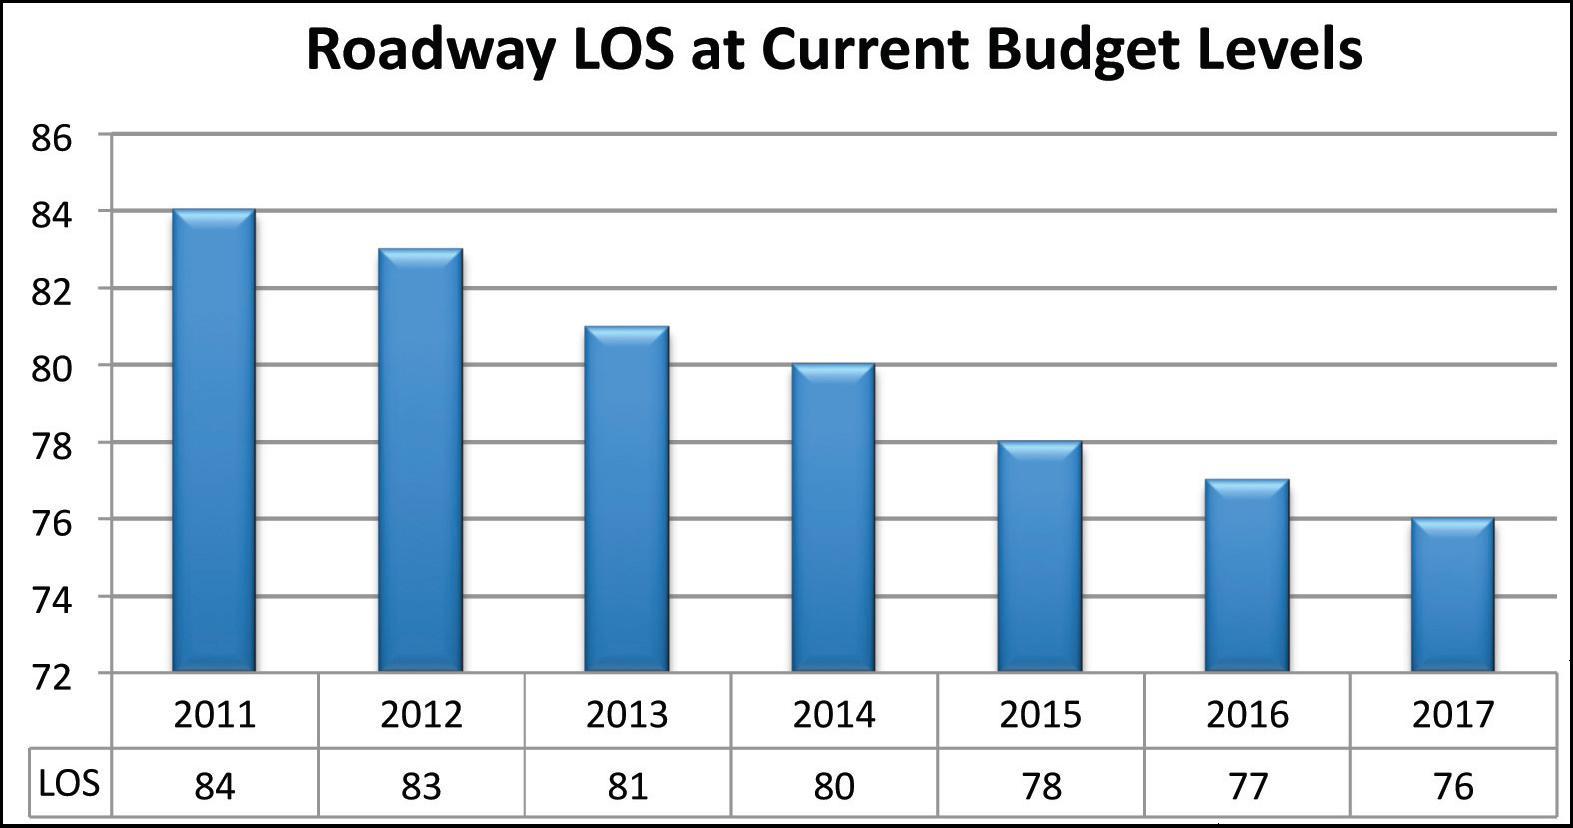
Figures 65 and 66 illustrate that pavements and overall composite conditions will decline with the percent of routes with "good" pavement conditions falling from 68 percent to 50 percent. NCDOT calculates an overall Level of Service or LOS based upon a composite of several condition factors. It forecasts that overall LOS will decline from 84 to 76 by 2017, on a scale of 0-100.
Figure 65: Forecasted pavement conditions at current budget levels.
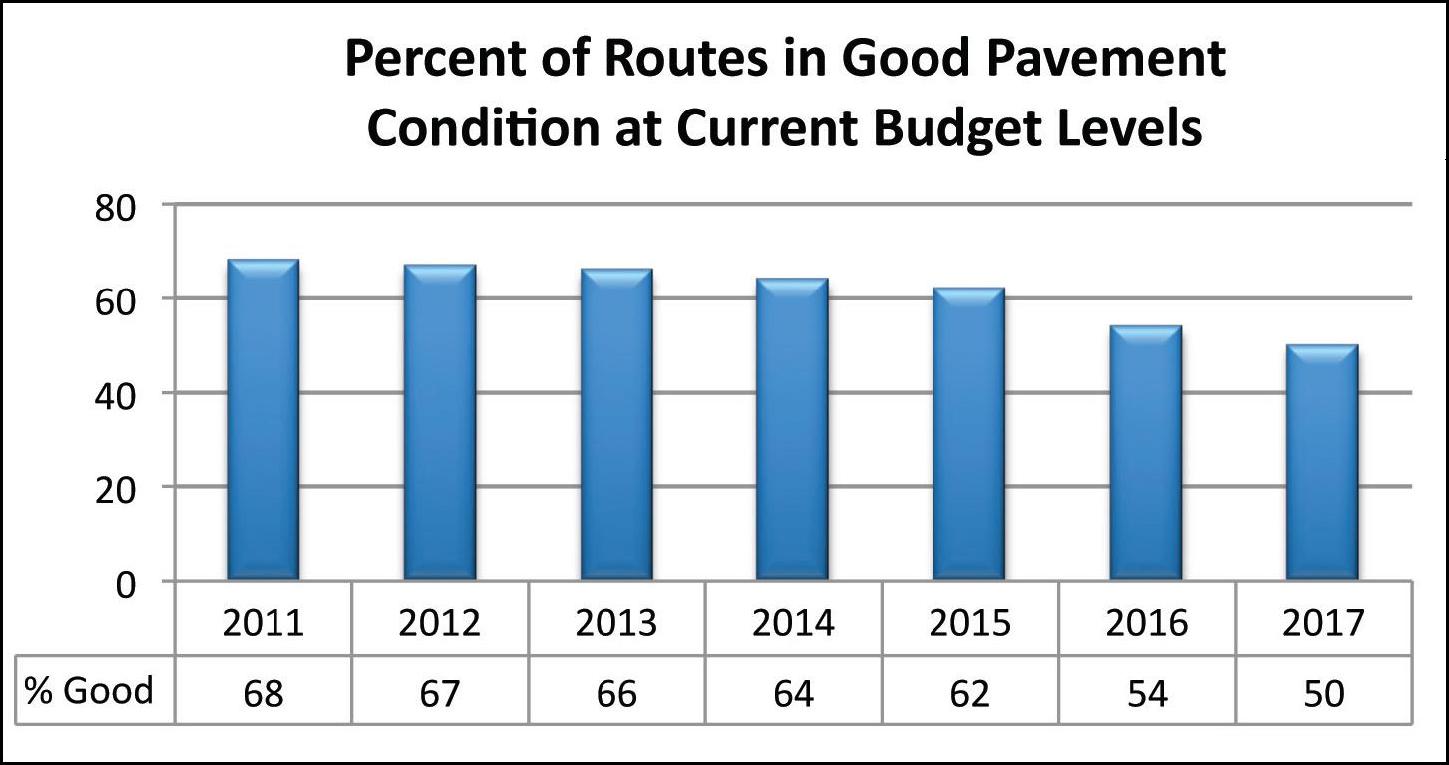
Figure 66: LOS forecast.
An overall composite Asset Sustainability Index is calculated in Figure 66 forecasted through 2017-2018. It illustrates that if current funding conditions remain static at 2010 levels, the overall department's ASI will fall from .76 to .60 by 2017-2018. Nearly $770 million additional would be needed to achieve the optimal ASI of 1.0 in 2017-2018.
Figure 67: NC ASI for maintenance categories, expenditures.
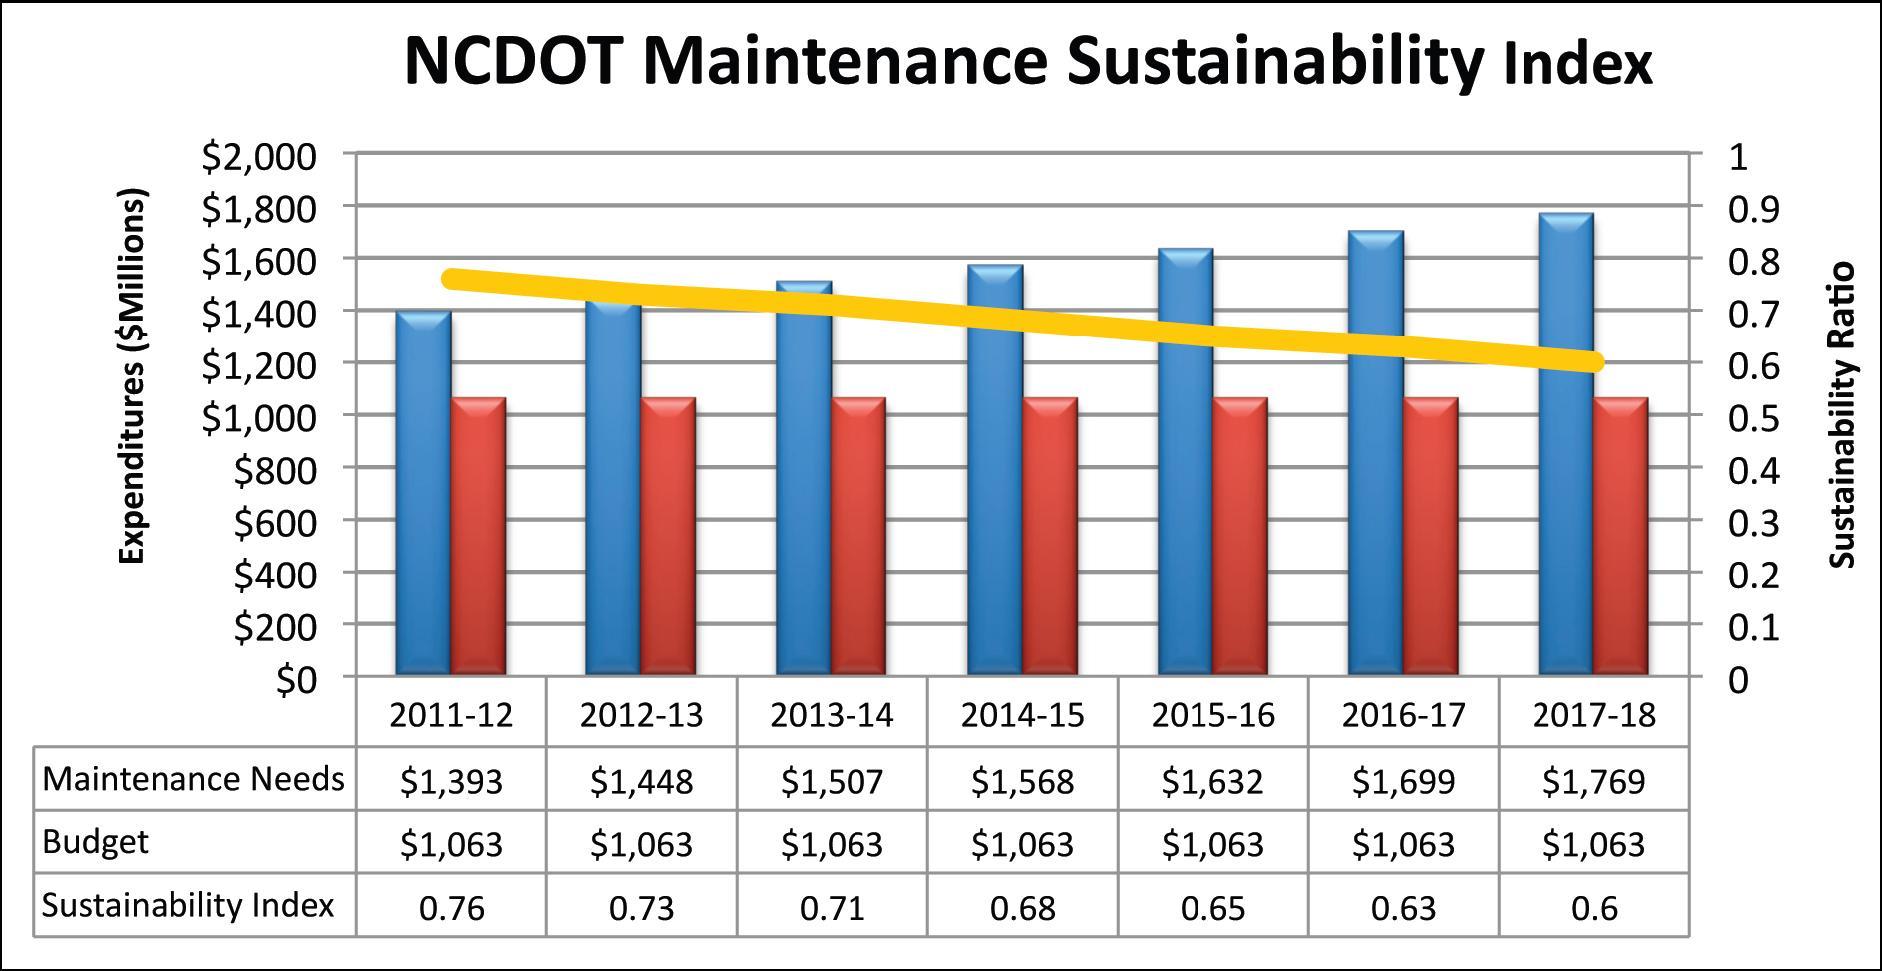
Care must be used in comparing the results of Figure 67 from seemingly comparable ASI and Pavement Sustainability Ratios cited earlier in the Ohio or Utah examples. Each State uses different definitions and categories of assets and expenditures so that they do not readily compare from State to State. In the earlier Ohio example, the analysis focused entirely on the State and Federal aid highway system, while in North Carolina it includes thousands of miles of local routes. Also, North Carolina uses very different budget categories than does Ohio or Utah. For instance, the resurfacing and reconstruction needs of the North Carolina Interstate Highway System are not included in these calculations. That system's long-term preservation is largely addressed through the federally funded State Transportation Improvement Program (STIP) projects using funds not eligible for the local routes.
As stated in the opening chapter, the intent of this report is to illustrate the proof of concept of the ASI and to illustrate how it can provide policy makers with enhanced understanding of the needed levels of investment required to sustain the highway system into the future. Although, the North Carolina budget categories and asset class definitions vary considerably from the other case study States in this report, its extensive asset management systems and sophisticated budgeting process provides the data to produce an ASI that is germane to North Carolina policy makers. Its policy makers are responsible for the local routes and therefore are interested in analysis of them. The North Carolina commission and legislators can see from the results of Figure 67 and the supporting data what the long-term consequences for the transportation system will be. NCDOT has appropriated to it approximately $1.063 billion in 2012 for total maintenance and preservation needs. By 2017-2018, the budget should increase to $1.769 billion if the State wants to achieve its highway system condition targets. Such analysis allows policy makers to understand not only how the physical conditions of the highway system are likely to degrade, but also they can calibrate the likely levels of investment necessary to forestall the degradation.
| << Previous | Contents | Next >> |