| << Previous | Contents | Next >> |
This chapter uses bridge condition and expenditure data from the Ohio, North Carolina and Minnesota DOTs to illustrate a Bridge Sustainability Ratio.
A review of the department's bridge analysis and investment over two decades allows the illustration of how Asset Sustainability metrics can be used to sustain acceptable bridge conditions, make tradeoff analyses and optimize investment into the highest asset priorities. The following analysis tracks ODOT bridge condition and budgets from 1997 to 2017. Although Ohio does not use metrics called "sustainability" metrics, it uses data that can provide inputs for sustainability metrics. It also operates under a philosophy of sustaining a "steady state" of high and continuously attained asset conditions. Those concepts are quite similar to the sustainability concepts discussed in this report.
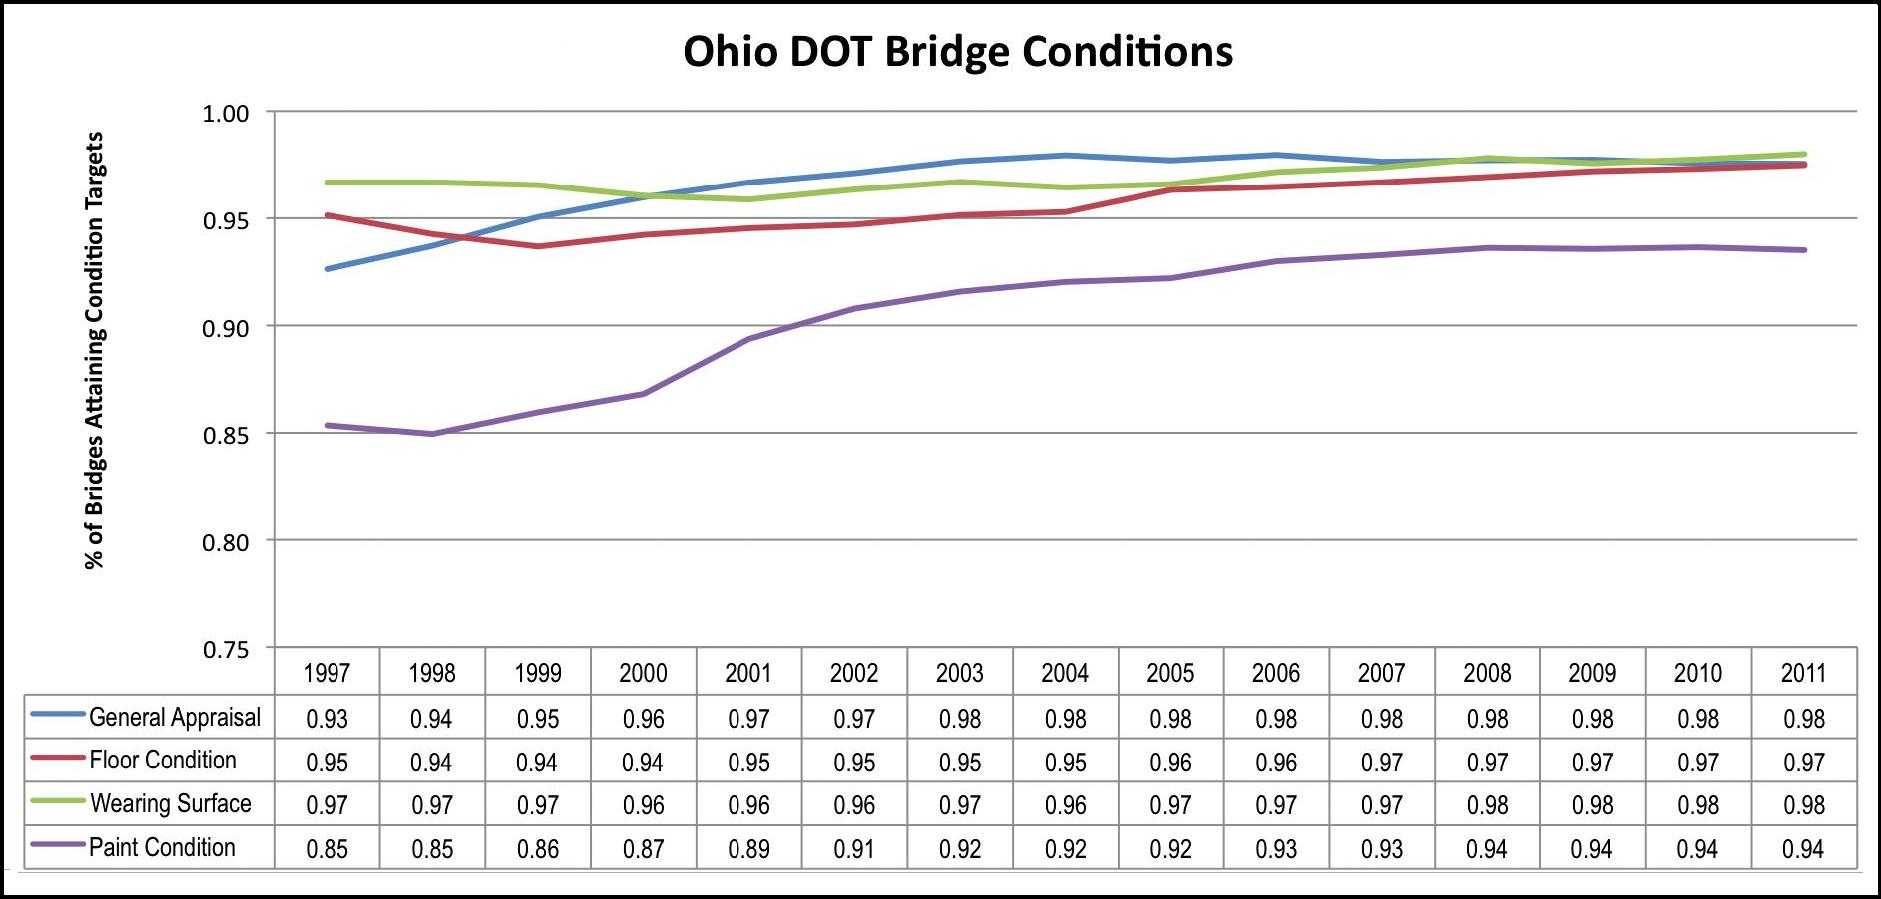
Figure 34: Ohio bridge conditions over time.
ODOT manages approximately 14,000 bridges out of a total statewide inventory of more than 28,000 bridges over 20 feet in length. Ohio defines a bridge as a structure greater than 10 feet in length. By its definition, 42,000 bridges are managed statewide. As a "Home Rule" State, the majority of Ohio bridges are locally managed, although ODOT is responsible for approximately two-thirds of the State's total bridge area. ODOT manages the nation's fifth largest bridge inventory, according to data from the National Bridge Inventory. Overall, it has the 14th highest percentage of total deficiencies in its entire statewide bridge inventory when both structural deficiencies and functional obsolescence are considered for all bridges, including local ones. However, ODOT has focused on its major bridges and when the National Highway System bridges are examined, Ohio's structural deficiencies on that system are the 28th lowest nationally.
As can be seen in Figure 34, the ODOT manages its bridge inventory through four primary rating categories which are:
The following section discusses how over a number of years the department calculated and periodically updated its analysis of conditions and needed budgets in order to sustain its bridges at its targeted level. This section examines estimates and budget allocations in 2006, 2008, 2010 and a pending update in 2011. Each update re-calibrated conditions and needed budgets during a volatile period when unit prices changed significantly and long-term funding was uncertain.
In its 2006 biennial business plan the department published the following high-level summary of expenditures and conditions that serve as a de facto Bridge Sustainability Ratio input. As shown in Table 15, budgets for bridge preservation ranged from $221 million in 2005 to a projected peak in 2010 of $258 million and subsequent decline again through 2015. The line of "% General Appraisal Acceptable" illustrates ODOT forecast that 98 percent of its bridge inventory would meet its general appraisal goal through 2010 falling to 97 percent after 2012. The Projected Shortfall illustrates the amount of deficit ODOT predicted in 2006 would be experienced if inflation in 2006 continued at the high rate it was experiencing at that time. The shortfall equates to what this report calls the Sustainability Gap. As shown in Table 15, that gap totaled $232 million from 2011-2015.
| 2005 | 2006 | 2007 | 2008 | 2009 | 2010 | 2011 | 2012 | 2013 | 2014 | 2015 | Total | |
|---|---|---|---|---|---|---|---|---|---|---|---|---|
| Bridge Preservation Budget | $141 | $141 | $170 | $179 | $187 | $197 | $145 | $147 | $148 | $150 | $151 | $1,756 |
| Major Bridge | $80 | $117 | $60 | $60 | $61 | $61 | $62 | $62 | $63 | $64 | $64 | $754 |
| Total | $221 | $258 | $230 | $239 | $248 | $258 | $207 | $209 | $211 | $214 | $215 | $2,510 |
| % Gen. Appraisal Acceptable | 98% | 98% | 97% | 97% | ||||||||
| Projected Shortfall or Sustainability Gap | ($48) | ($52) | ($58) | ($34) | ($40) | ($232) |
These numbers allow a Bridge Sustainability Ratio to be developed for the period 2005-2015 as shown in Table 16.
| 2005 | 2006 | 2007 | 2008 | 2009 | 2010 | 2011 | 2012 | 2013 | 2014 | 2015 | Total | |
|---|---|---|---|---|---|---|---|---|---|---|---|---|
| Bridge Budget | $221 | $258 | $230 | $239 | $248 | $258 | $207 | $209 | $211 | $214 | $215 | $2,510 |
| Bridge Need | $221 | $258 | $230 | $239 | $248 | $258 | $255 | $261 | $269 | $248 | $255 | $2,742 |
| Bridge Sustainability Ratio | 1.0 | 1.0 | 1.0 | 1.0 | 1.0 | 1.0 | 0.8 | 0.8 | 0.8 | 0.9 | 0.8 | |
| Sustainabiilty Gap | 0 | 0 | 0 | 0 | 0 | 0 | -$48 | -$52 | -$58 | -$34 | -$40 | -$232 |
| ($millions) |
As the department did with its earlier pavement shortfall, it revisited its forecasts in its 2008 Business Plan and again in its 2010 Business Plan update. Those updates showed that inflation had cooled from a high of more than 12 percent to between 4 and 5 percent. Despite slowing, the rise in material costs still required additional investment to sustain conditions. As a result as shown in Table 17, ODOT increased bridge investment in its 2008 and its 2010 budget updates. Overall, bridge budgets increased by $468 million over the period of 2008-2015 compared to what had been forecast to be spent during that period in the original 2006 forecast. ODOT sustained its general appraisal conditions at 98 percent acceptable with the additional budgeted amounts and continued the sustainable bridge conditions.
| 2006 | 2007 | 2008 | 2009 | 2010 | 2011 | 2012 | 2013 | 2014 | 2015 | 2016 | |
|---|---|---|---|---|---|---|---|---|---|---|---|
| Bridge Budget 2010 Business Plan | $258 | $230 | $254 | $262 | $227 | $270 | $277 | $313 | $325 | $341 | $358 |
| Difference from 2006 | $15 | $14 | -$31 | $63 | $68 | $102 | $111 | $126 | |||
| Difference from 2008 | $7 | -$5 | -$56 | -$17 | -$16 | -$8 | $31 | $53 | |||
| % Gen. Appraisal Acceptable | 0.98 | 0.98 | 0.96 | 0.96 | 0.96 | 0.96 | 0.96 | 0.96 | 0.96 | 0.96 | 0.96 |
| BSR as of 2006 Business Plan | 1.00 | 1.00 | 1.00 | 1.00 | 1.00 | 0.81 | 0.80 | 0.78 | 0.86 | 0.84 | |
| BSR as 2010 Business Plan | 1.00 | 1.00 | 1.00 | 1.00 | 1.00 | 1.00 | 1.00 | 1.00 | 1.00 | 1.00 | 1.00 |
| All dollars in millions | Actual | Forecast | |||||||||
As shown in Table 17, the forecasted conditions indicate that with the higher budgets, ODOT will sustain its target which was 98 percent acceptable through 2007 when it was changed to 96 percent acceptable. ODOT forecast future bridge conditions based upon the programmed projects and its deterioration curves for each of the four categories of condition, General Appraisal, Floors, Wearing Surfaces and Paint.
In the Executive Summary and in Chapter 4, this report discussed how the Asset Sustainability metrics can aid in trade-off analysis. They also can assist with detailed optimization analysis. Resources can be redirected from where there is a ratio greater than 1.0 to assets, or systems or regions where investment is less than 1.0. The type of analysis conducted in Ohio allowed such tradeoffs to occur.
Figure 35: General appraisal conditions by district.
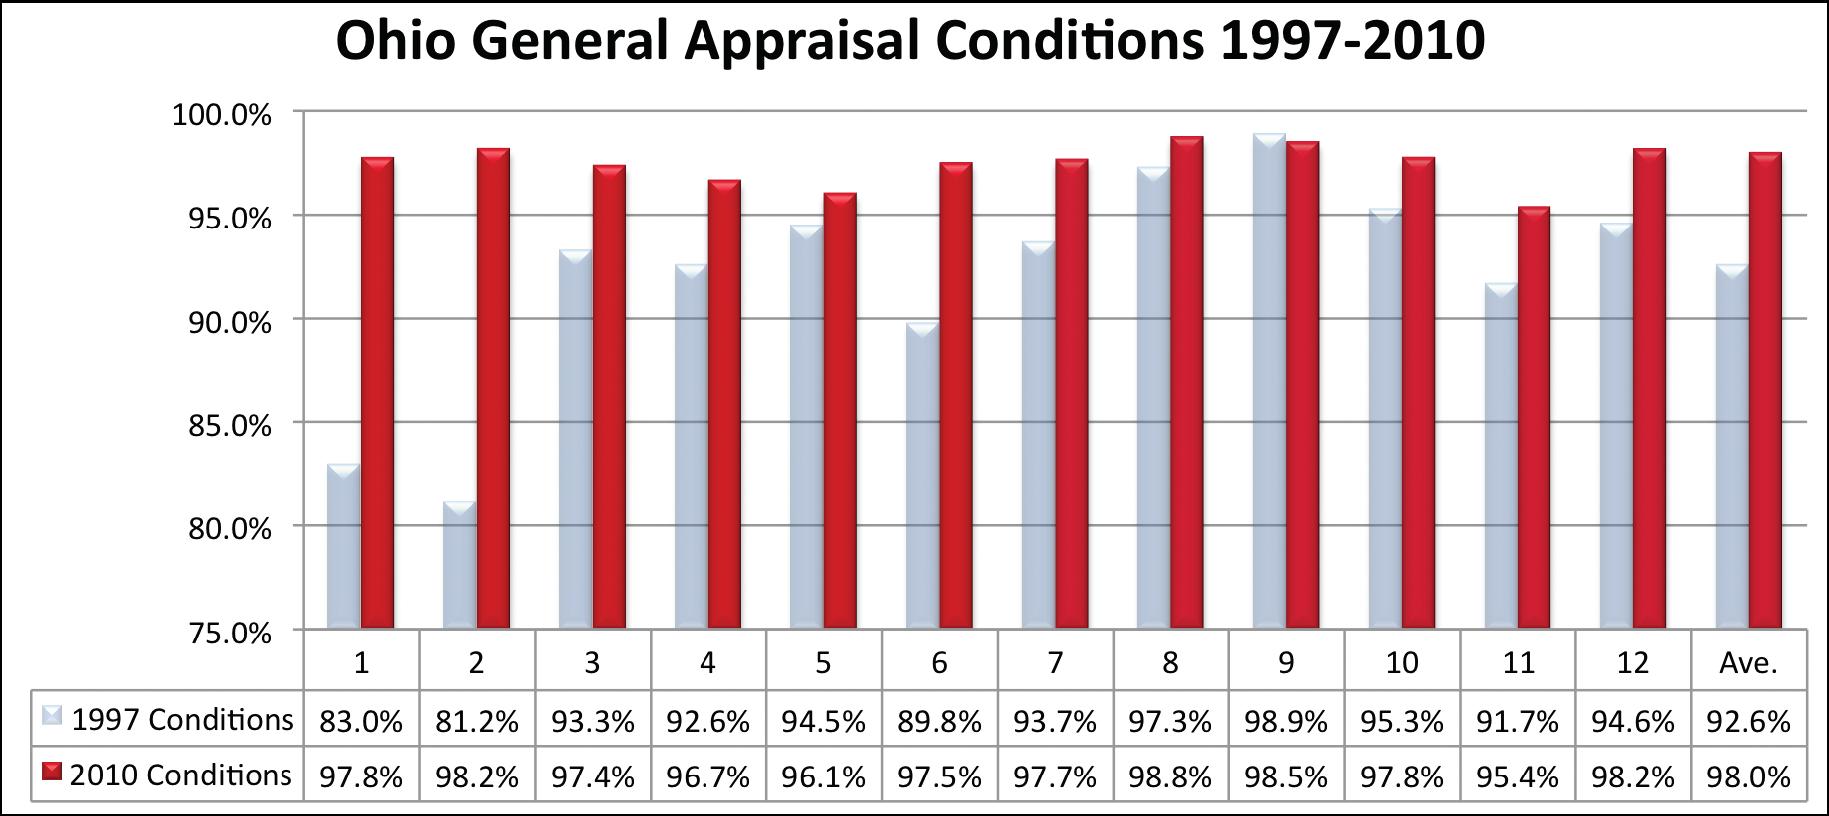
As seen in Figure 35, when ODOT began its asset management process in earnest in 1997, 92.6 percent of its statewide bridge inventory met its General Appraisal target of 5 or greater out of a scale of 0-9. Districts 8 and 9 nearly met the 2010 goal of 98 percent acceptable when the asset management process began in 1997. In 1997, ODOT had a goal of 90 percent of its bridges meeting the General Appraisal target. At that lower goal, nine of the 12 districts met target. Two districts, 1 and 2 were substantially below the target.
Figure 36: Statewide bridge condition changes.
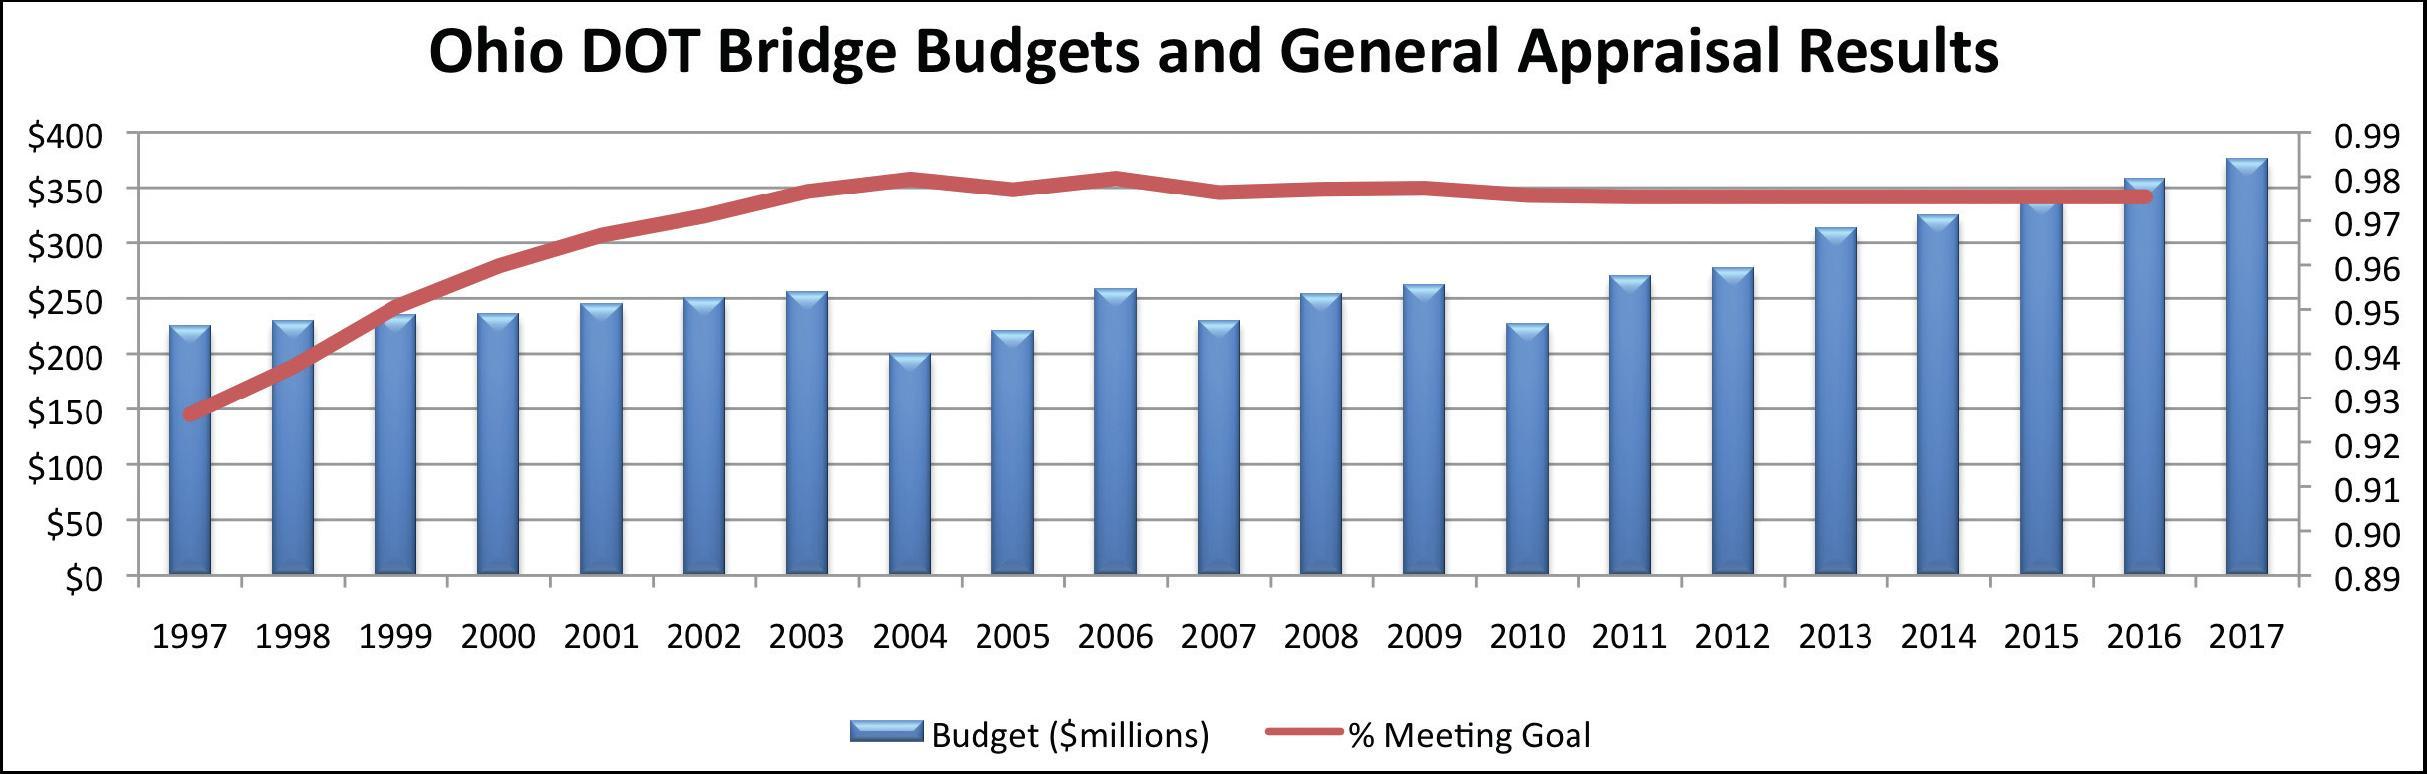
As seen in Figure 36, ODOT achieved a steady improvement in bridge General Appraisal condition between 1997 and 2003 by focusing closely on deficient bridges for improvement and by increasing bridge budgets from $225 million to $256 million, or 14 percent. Bridge condition improvements increased more than did the commensurate increase in spending. Although the percent of bridge area meeting the General Appraisal goal rose from 92.6 percent to 97.5 percent, that represents a 64 percent reduction in the area of structurally deficient bridges. The area of structurally deficient bridges declined from 5.9 million deficient square feet to 1.9 million. This disproportionate improvement occurred because of closely calibrated tradeoffs in which funds were moved from districts and from bridge categories that met target to those that did not. Reductions in expenditures occurred in years such as 2003 when Ohio's Federal apportionment declined because of a budget reconciliation issue and again in 2010 as ODOT wrestled with inflationary pressures. The reductions in bridge allocations in those years were possible because of the relatively robust bridge conditions. Rational tradeoffs could be made and funds could be prioritized for pavements, which were not in as good a condition.
As seen from the condition curve in Figure 36, from 2003 through 2011 Ohio sustained a "steady state" or sustainable bridge inventory condition with a steady and predictable level of investment. Starting in 2012, bridge budgets are to rise steadily to compensate for higher material prices. The State's level of effort in terms of bridge square footage of improvement annually is predicted to remain fairly steady but the unit prices of bridges are predicted to continue a slow, steady rise of between 4 percent and 5 percent annually. With such an inflation forecast, ODOT can predict and plan for a commensurate increase in bridge investment through 2017 to sustain its bridge inventory conditions.
The asset sustainability metrics are intended to support decision making. They illustrate the magnitude of needed investment and they illustrate probable consequences of current investments at a system-wide level. They also allow "drilling down" into the asset level or regional level to further support decision making, including the making of tradeoffs.
Figure 37: Ohio deck condition changes.
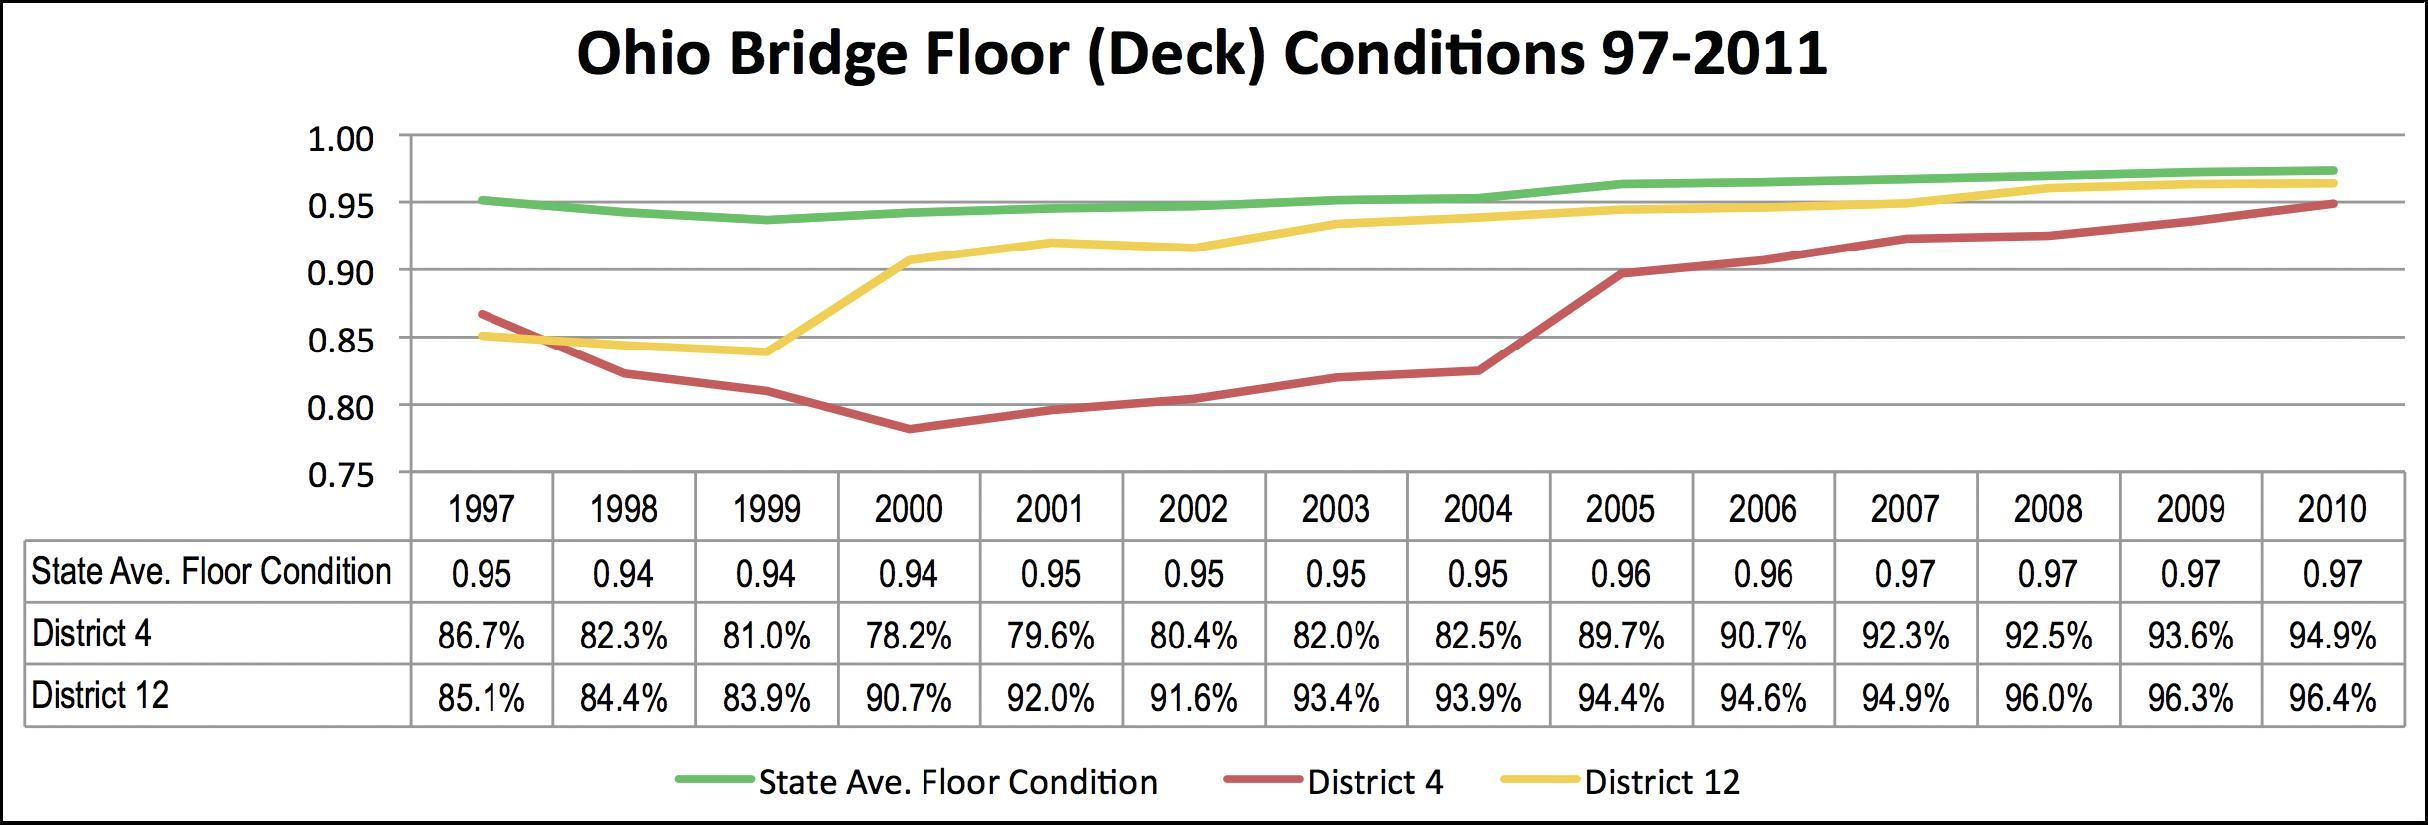
The Ohio process allowed the agency to identify areas of sub-goal performance and under-investment in selected areas of its infrastructure. As mentioned earlier, Floor or Deck conditions are one of the four areas of bridge measurement. As can be seen in Figure 37, statewide 95 percent of bridges met the Floor condition target in 1997 but two districts, 4 and 12, were considerably below target. Those districts' Floor conditions worsened to a low point for District 4 in 2001 when more than 20 percent of all of its deck area was deficient. For District 12, nearly 16 percent of its total deck area was deficient.
Figure 38: Shifting budgets to address deficiencies.
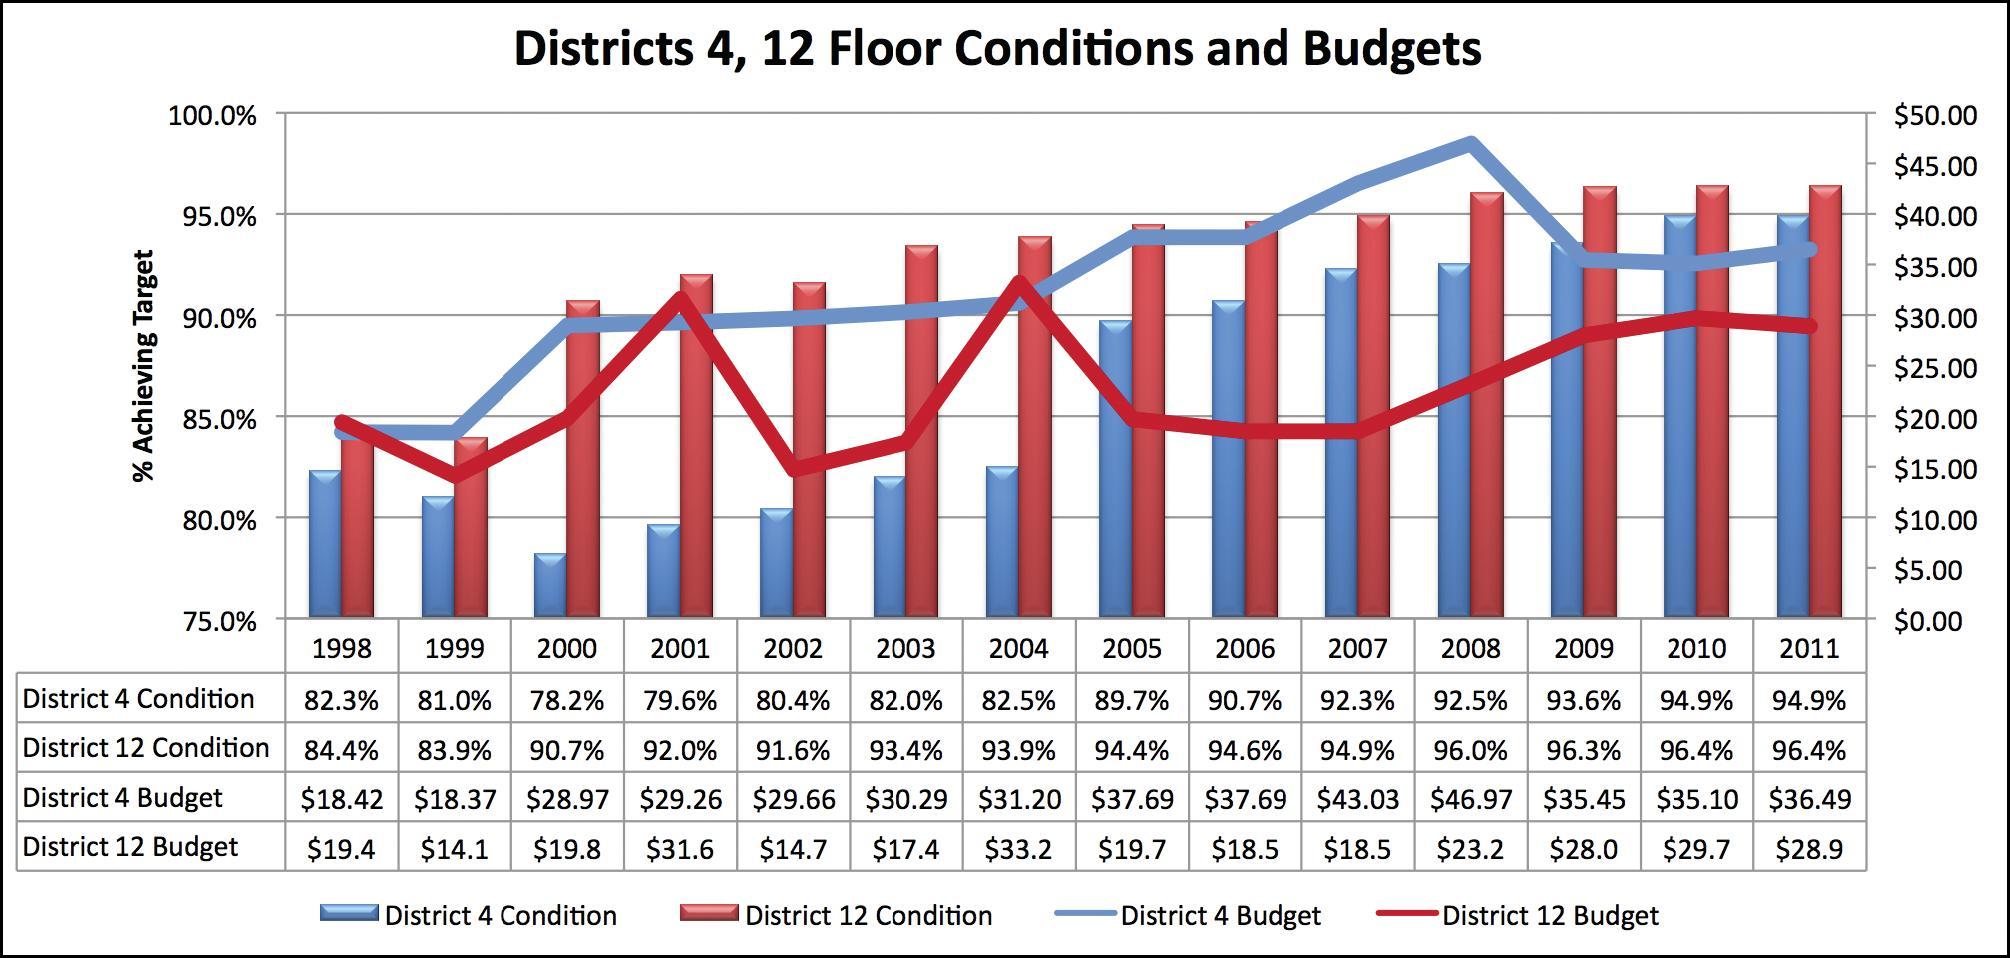
As seen in Figure 38, bridge budgets were increased for both districts along with accountability for targeting deficient bridge floors. District 4's bridge budget rose substantially and with its increased investment it focused upon its floor conditions. The district had the State's third largest bridge inventory and its greatest overall volume of traffic. Its bridge budget grew from a low of $16.9 million in 2000 to a high of $46.4 million in 2001 to "kick start" its bridge improvement effort. The budget varied somewhat year to year but remained more than twice its level from the late 1990s and remains so through the forecast period of 2011. As can be seen, the district's percentage of "Good" Floors rose from a low of 79.6 percent to a high of 94.9 percent by 2010. The statewide goal for 2010 is 96.2 percent acceptable, just above District 4's 2010 condition, as seen in Figure 39.
To achieve the increase in investment, bridge funds from districts with higher conditions were shifted. In effect, high-performing districts were expected to enter a "preventive maintenance mode" and the extra funds were shifted to the areas of poorer performance. Greater accountability accompanied the increase in funds and districts were given performance metrics to achieve. The intent was not to "reward bad behavior" by giving districts with worse conditions more funds without a commensurate increase in accountability.
The District 4 and District 12 example allows re-creation of District Bridge Sustainability Ratios. With Bridge Sustainability Ratios for all 12 districts it would allow ODOT to readily identify, and communicate to decision makers, how funds need to increase or decrease over time among the districts to sustain conditions.
Figure 39: Improving conditions over time.
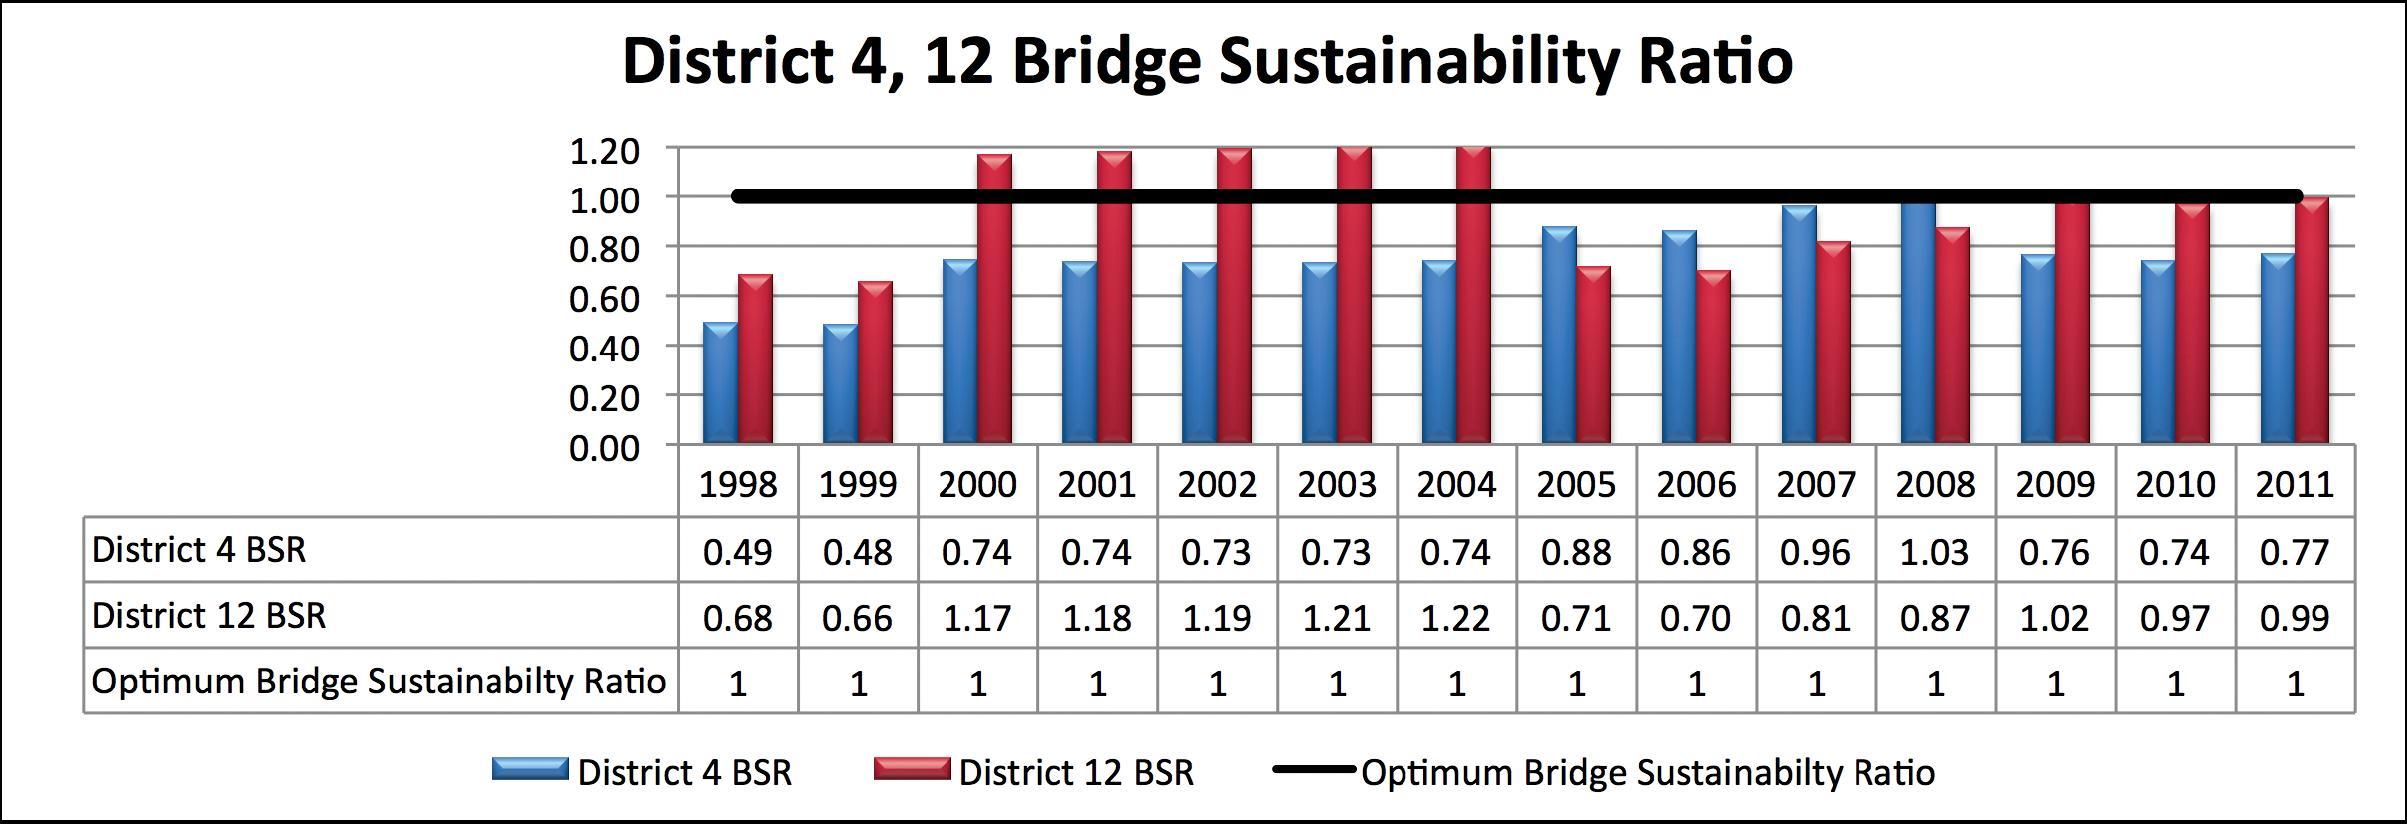
As Figure 39 illustrates, the Bridge Sustainability Ratios for the two districts moved from a low of .48 for District 4 in 1999 to 1.03 by 2008 before falling again to approximately .75. Similarly, District 12's increased from a low of .66 in 1999 to above 1.0 level by 2000.
Figure 40: Shifting bridge allocations over time.
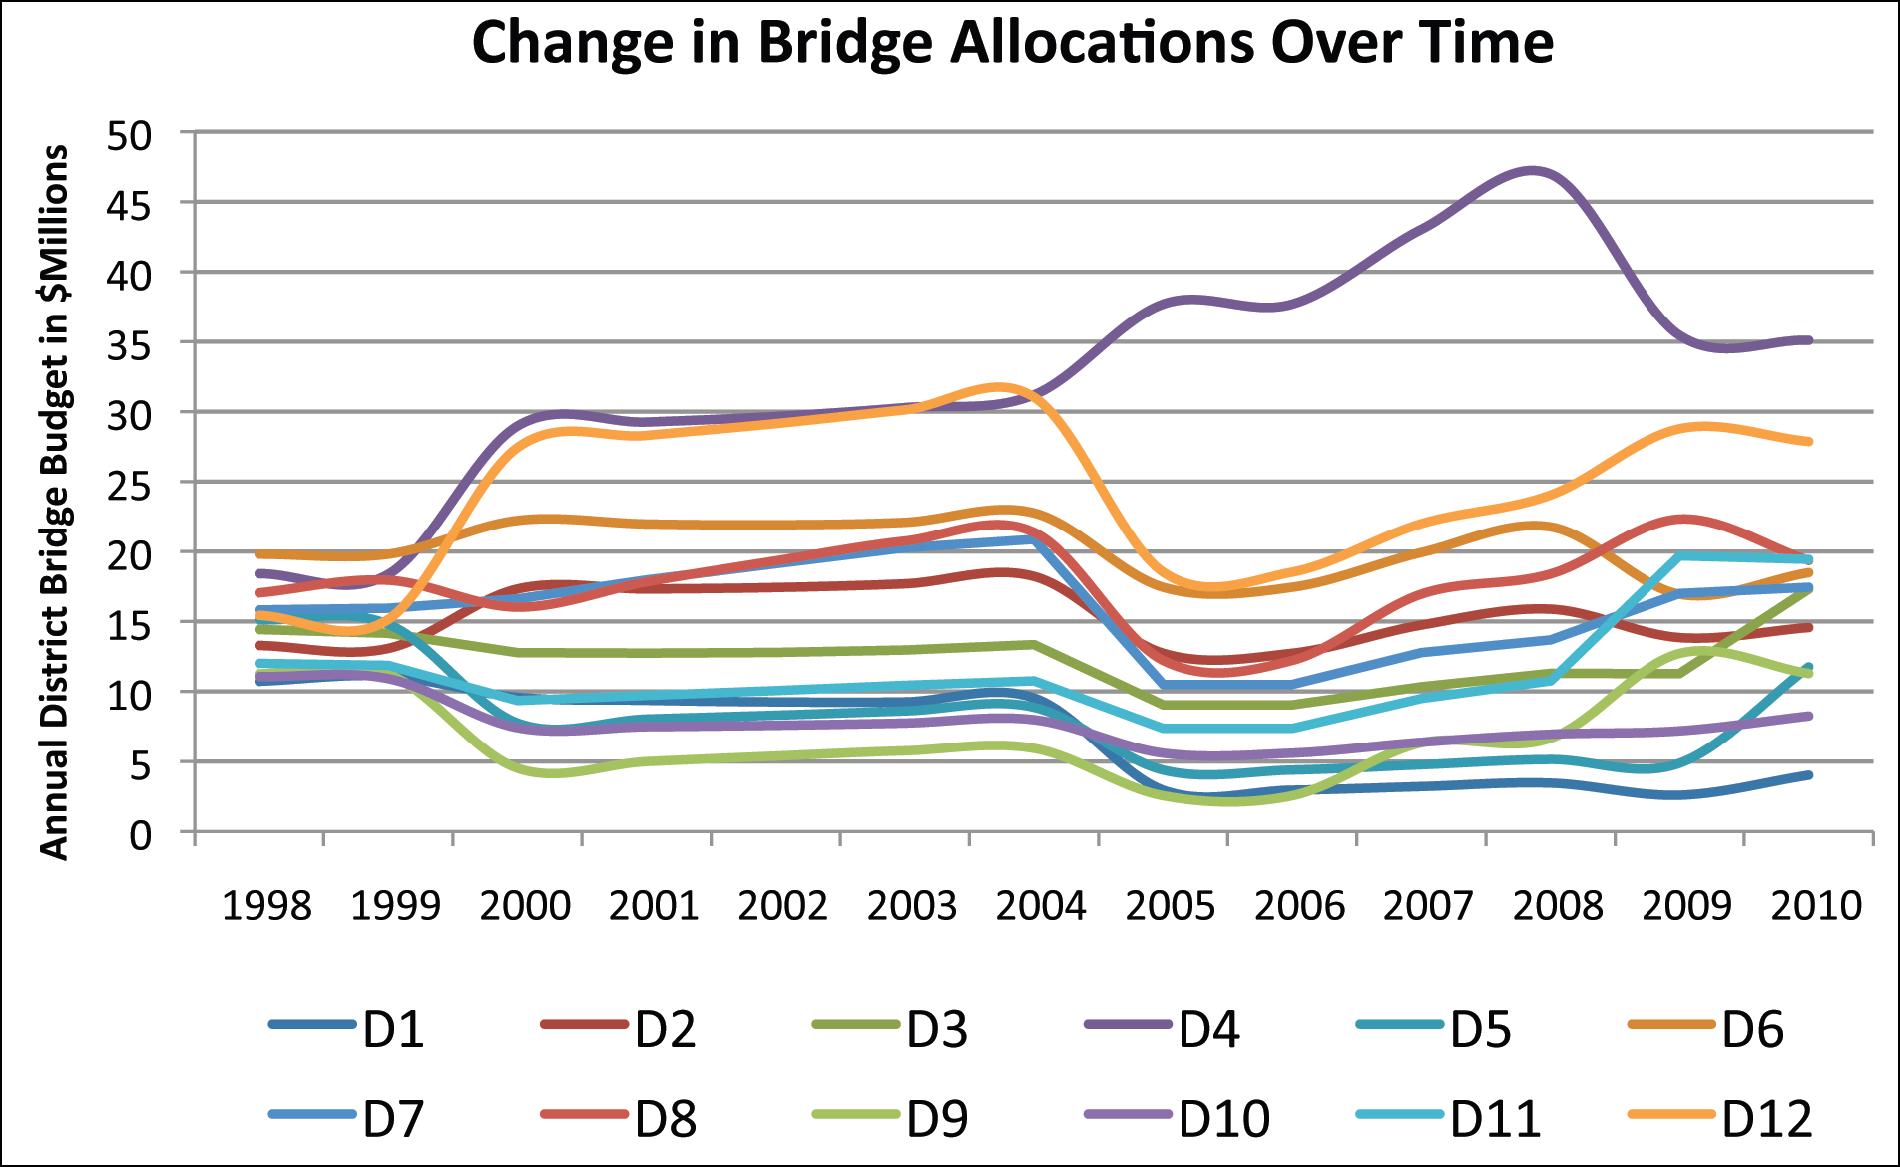
Although only two districts are illustrated here, similar calculations are possible for each district. Also, this illustration examines only one of the four Ohio deficiencies, namely Floor conditions. Similarly, Sustainability Ratios could be produced for each category of deficiency and for each district. Such an expanded analysis would build from the "heat map" illustrations shown later in Figure 43. The calculations would reflect the types of tradeoffs illustrated in Figure 40.
Figure 40 illustrates the shift in bridge budgets between 1998 and 2010 between the various districts. Starting in 1999, six district's allocations went down and six went up as a result of the trade off analyses that underlie the efforts to "normalize" conditions by pulling up the conditions in the districts with below-average bridge conditions.
Figure 41: District 1 bridge funding shifts.
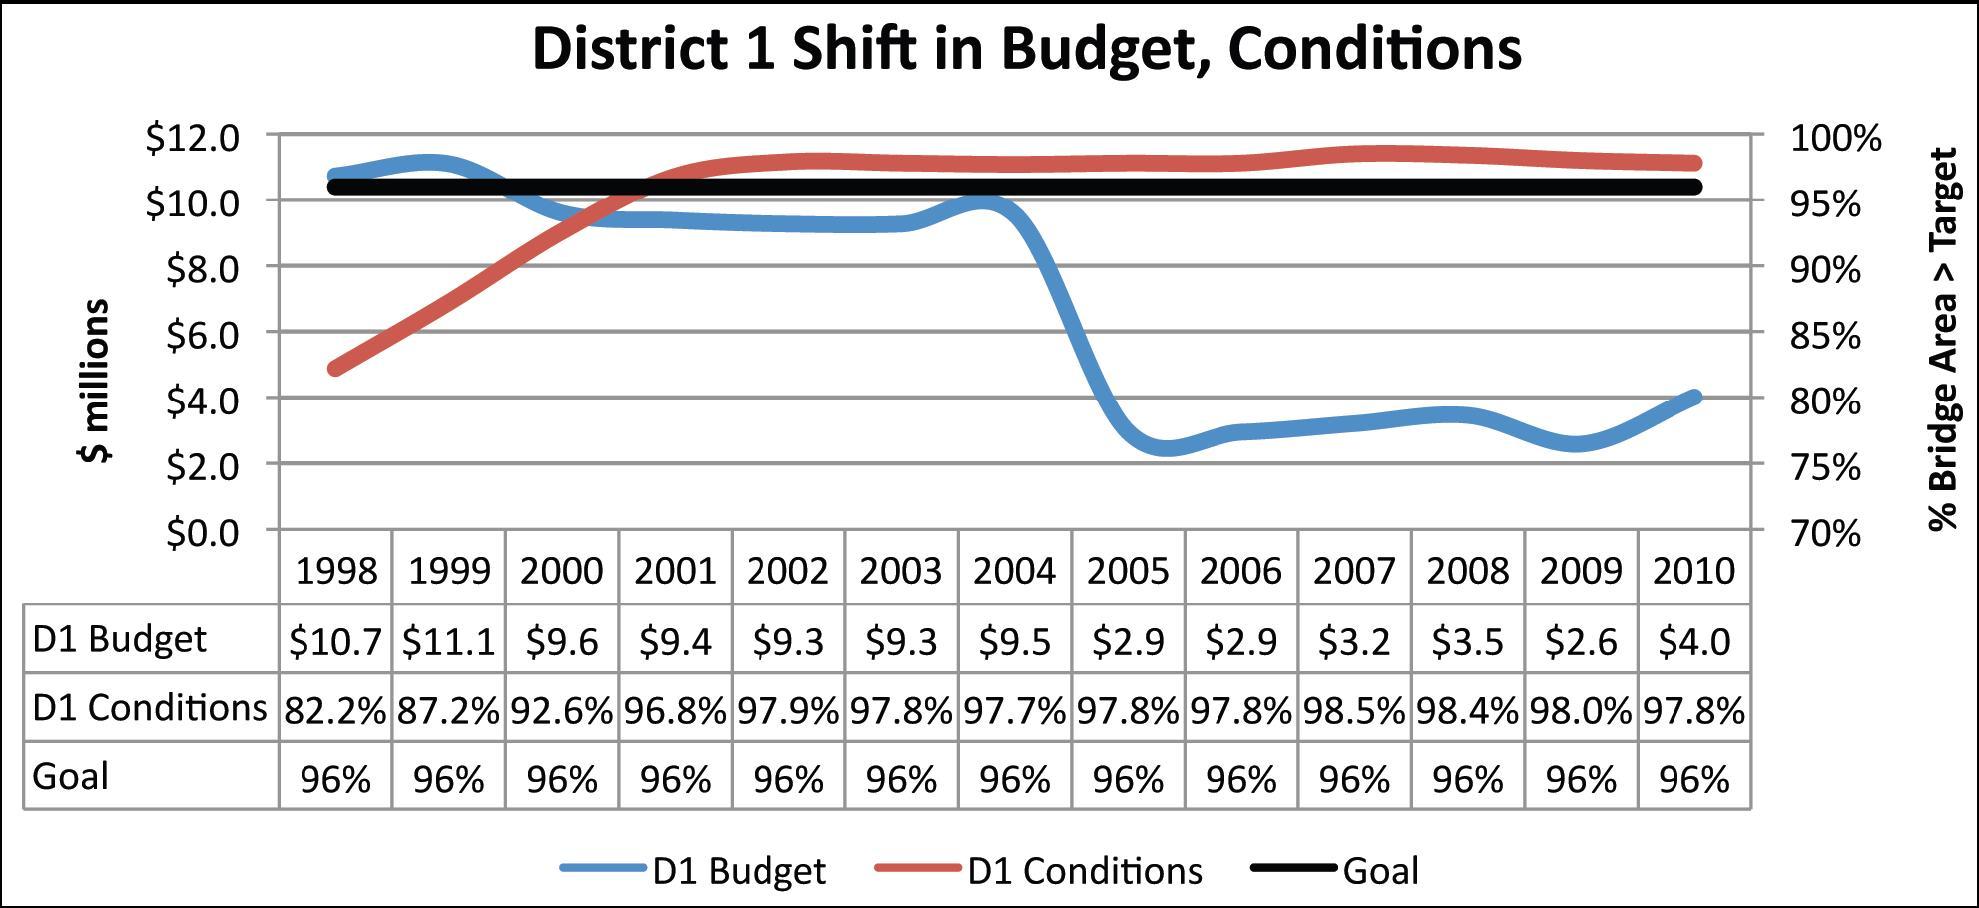
Figure 41 illustrates one component of the statewide tradeoffs by illustrating the trade-off results for the ODOT District 1. It is an example of a district from which funds were reduced once it reached its condition targets. Its district bridge budget remained at between $9 million and $10 million annually from 1998 through 2004 when it reached its bridge condition goals. Bridge forecasts indicated it did not need to continue investing at that level to sustain its condition. It moved into a bridge preventive maintenance mode and the excess funds above those needed to sustain its conditions were transferred to other districts that were below their established goals. As seen in the Figure 42 data table, nearly $7 million annually was available after 2005 to transfer from District 1 to other district bridge needs. Similar trends occurred in the other six districts from which funds were reduced in that period.
Figure 42 illustrates the shifting statewide calibration of investment and results in another way. The "heat map" depicts areas of concern in "hotter" colors such as red and yellow. Shades of green illustrate the degree to which standards are being met. Each heat map includes all 12 districts and one of the four condition categories. The maps illustrate the transition from many "hot" colors in the 1990s when bridge goals were not being met to a predominance of green colors in the 2000s as goals were met. Commensurate with the changes in condition were changes in district budgets to address the deficiencies and changing priorities that the districts addressed. Ohio's overall bridge expenditures rose steadily overall but shifted more substantially between districts over time, as seen in the case of District 4.
Figure 42: Heat map of bridge conditions showing shifting conditions over time.
The Figure 42 Heat Map illustrates the steadily improving floor conditions in Districts 4 and 12 and the sustaining of overall floor conditions in the other districts and statewide.
Commensurate with the sub-par performance across the districts over time, were commensurate increases and decreases in bridge budgets to achieve the desired targets.
This granularity allows creation of a Bridge Sustainability Ratio for each district and for each category of bridge condition. This type of detail allows informed tradeoffs to be made.
The sustainability metrics allow "drilling down" into each asset, each asset class, or each district to calibrate needed investment. Ohio has 12 districts, 17 MPOs, 88 counties, 251 cities and 1,100 townships, all who have at least partial responsibility for infrastructure. The granularity possible through the Asset Sustainability metrics allow the disaggregation of trends for localized decision making at the district, MPO, city or other level.
Figure 43: Statewide "heat map" of bridge conditions and associated sustainability ratio.
Figure 43 shows an estimated, re-created set of Sustainability Metrics for each category of Ohio bridge deficiency from the time period 1997 through 2016. It should be stressed that for the years before 2006, these are estimates based upon a recreation of the budget and condition assumptions for the years 1997 through 2006. In the early years of the period, the tradeoff analysis would indicate that the bridge funds should be focused primarily upon General Appraisal and Paint. As those conditions improved over time and backlogs of deficiencies were removed, the bridge program focus spread more to all four deficiency categories to ensure that all the categories reach their goals.
The years in this forecast from 2011 through 2016 indicate that the department has budgeted enough in all four bridge deficiency categories to sustain its bridge conditions, at least through the 5-year forecast. One additional element of analysis ODOT performs to further enhance its forecast is to estimate the magnitude of bridge area that is likely to fall into a deficient category within the next 5 years. It analyzes the programmed projects to determine if a sufficient amount of those "almost deficient" bridges are programmed and will be addressed in the next 5 years. The intent of that additional exercise is to further improve the chances that a large backlog of deficiencies is not pending in the years ahead.
The MnDOT produces long-term investment need forecasts as well as long-term budget estimates that together can produce a Bridge Sustainability Index for the department.
The MnDOT Bridge Sustainability Index and its related analyses provide important financial, policy and programming insight for State policy makers. First, the indices indicate that Minnesota will achieve and sustain its bridge condition targets through 2018. Second, the bridge investment adequacy is in contrast to the documented inadequacy of pavement investments. Third, although bridge condition targets through 2018 will be met, they will be funded through a large increase in funds to replace major structures. An equally large investment beyond 2018 appears to be needed in order to sustain the conditions of an aging inventory of State bridges, not addressed by the large-bridge program.
MnDOT produces an annual Minnesota Bridges report that analyzes the conditions of the State's bridge inventory and notes important changes and trends. Minnesota State law defines a bridge as a structure over 10 feet in length, as opposed to the Federal definition for a bridge which is a structure over 20 feet. As a result, MnDOT produces extensive condition data using both the State and Federal definitions. It also analyzes and reports upon bridge conditions not only for structures under DOT control but also for ones that are owned by cities, counties, townships and railroads. The analytic data allows analysis of bridges by condition, by functional class, by ownership, by condition category and by changes over time.
MnDOT reports conditions on 3,898 structures over 20 feet in length, thus meeting the Federal definition, and which are on the State's "trunk" system. The Trunk Highway System consists of the interstate highways and State routes. It also reports upon another 9,813 structures over 20 feet in length that are on the local system. Finally, it reports on the 8,437 structures less than 20 feet in length on both the trunk and local systems.
Minnesota bridge conditions are above national averages. The National Bridge Inventory reports that 8 percent of the bridge area on the National Highway System is structurally deficient nationwide. In Minnesota, only 4.05 percent of the NHS bridge area is structurally deficient. Its Trunk Highway System bridges have an overall sufficiency rating of 89.9 out of a possible 100 and have an average age of 31.9 years, compared to a national average of 43 years.
In addition, MnDOT bridge conditions have steadily improved. As seen in Figure 44, the number of Trunk Highway System bridges with a Sufficiency Rating of less than 50 steadily has declined. When measured by area, the area of bridges with Sufficiency Ratings less than 50 also has fallen from3.6 million square feet in 2001 to 2.1 million in 2010, or a 39 percent decline.
Figure 44: Improvement in MnDOT sufficiency ratings.
Despite the sound current conditions, the MnDOT reporting process attempts to keep policy makers appraised of the long-term consequences of investment decisions. It notes that its percentage of bridges in the "fair" condition categories still exceeds its optimum targets. As those bridges age and sustain use, they will create future long-term liabilities for the State. The Minnesota legislature through a statute known as Chapter 152 required MnDOT to substantially increase its bridge spending following the collapse of the I-35 bridge. MnDOT is required to replace 120 bridges that are either structurally deficient or functionally obsolete. These extraordinary expenditures will improve the overall bridge inventory through 2018 but they will not address all bridges that beyond 2018 will fall into an unacceptable condition category. Structures that are not fracture-critical or structurally deficient today will not be replaced by the Chapter 152 program.
Figure 45: Age profile of MnDOT bridges.
"It is important to address bridge rehabilitation and replacement needs that fall outside the Chapter 152 program," notes MnDOT's 2010 bridge report. "Funding of other bridge needs at the recommended investment guidance level...is highly encouraged. The deferral of investment toward those needs will compound the needs in the long-range plan years, which are more than double the amount of needs in the (2010-2018) years. Deferring bridge replacement or improvement projects may also result in more frequent reactive maintenance."
Figure 45 illustrates the long-term trends facing Minnesota as its bridge inventory ages. More than 17 percent of its bridge inventory when measured by size already is in its fifth decade, and the inventory will steadily age. Its current bridge expenditures represent a short-term increase to address the Chapter 152 structures through 2018. Although by 2018, MnDOT will have reached its current condition targets, and complied with the Chapter 152 statute, it will face larger and more expensive costs to repair, rehabilitate and replace an even larger pool of bridges that by 2018 will grow considerably older and will have experienced significant loadings.
| Route System | Bridges | Culverts | Total Structures | Avg. Age | Deck | Super | Sub | Culv. | Struct. Eval | Suff Rating |
|---|---|---|---|---|---|---|---|---|---|---|
| Interstate | 1140 | 70 | 1210 | 32 | 6.6 | 6.8 | 6.8 | 6.4 | 6.6 | 89 |
| Truck | 1685 | 744 | 2429 | 32 | 6.8 | 7.1 | 7 | 6.6 | 6.7 | 90.3 |
Table 18 illustrates the overall good condition of the MnDOT structures today when viewed by collective averages. The average age is 32 and major categories of bridge components such as decks and superstructures have an average score in the 6s out of a maximum score of 9. As can be seen, the overall Interstate bridge inventory's sufficiency rating averages an 89 and the Trunk Highway System bridges a 90.3 out of a possible score of 100.
The MnDOT bridge report provides details that allow analysis of the bridge inventory conditions beyond the averages. In addition to the overall average conditions, it tracks the number of bridges in "fair" and "poor" condition to ensure those categories do not exceed acceptable numbers that would not be apparent if only average inventory-wide conditions were measured.
In addition to the voluminous National Bridge Inventory information the department reports, it also has set Minnesota-specific targets for its bridges. The three targets are:
The Structural Condition Rating is a broad measure of the structural components of the bridge. Each bridge is categorized as Good, Satisfactory, Fair or Poor by using four National Bridge Inventory Codes and 2 NBI appraisal ratings. The four codes are Deck Condition, Superstructure Condition, Substructure Condition and Culvert Condition. The Appraisal ratings are for Structural Evaluation and Waterway Adequacy. All the condition codes and appraisal ratings are on a scale of 0-9 with 9 being excellent and 0 closed.
The Geometric Rating is a broad measure of the geometric properties of the structure. Each bridge is categorized as Good, Fair, or Poor by using the NBI appraisal categories of Deck Geometry, Underclearance (both vertical and horizontal), Approach Roadway Alignment and Waterway Adequacy.
The Posted Bridges and Load Carrying Capacity measures the bridge's ability to carry legal and overweight loads. Each bridge is categorized as to whether it:
Figure 46: Bridge conditions and targets over time.
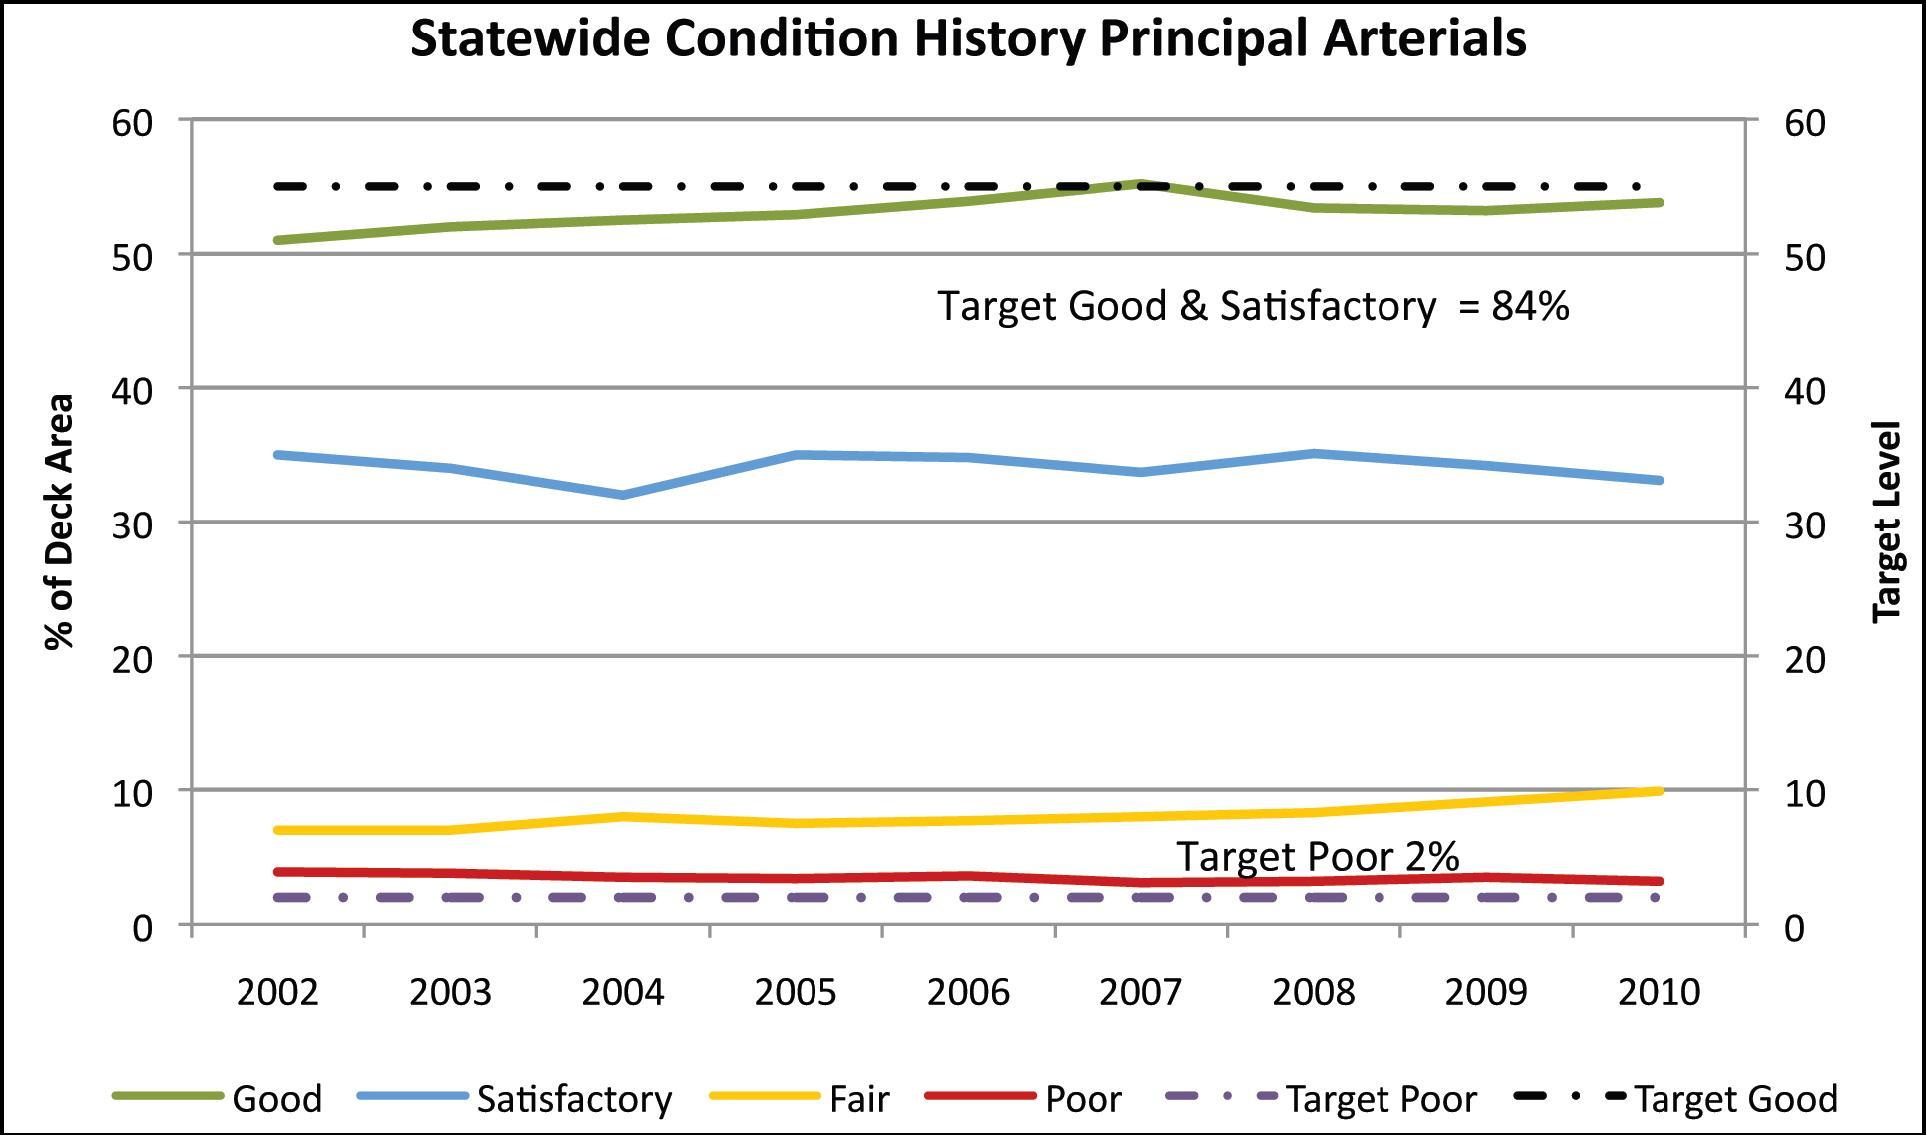
Figure 46 shows the performance of bridges on Minnesota's principal arterials from 2002 through 2010. During that period, the percentage of Good bridges gradually increased while the Satisfactory bridges declined only slightly. However, there was a slight but steady increase in the Fair bridge conditions. Those bridges entering the Fair category are likely to need substantial work in the next decade and represent a long-term financial need for the department.
| 2009-2018 | |
|---|---|
| Chapter 152 Need | $2,420 |
| Chapter 152 Budget | $2,420 |
| Chapter 152 Ratio | 1.00 |
| Other Bridge Need | $720 |
| Other Bridge Budget | $780 |
| Other Bridge Ratio | 1.08 |
MnDOT reports in its 2010 bridge report and in its Highway Investment Plan Annual Update 2011-2020 that it will exceed its bridge targets by 2018. Its target is to have 84 percent of its bridge inventory on principal arterials in a Good or Satisfactory Condition. As seen in Figure 46, its 2010 conditions are that 87 percent are in Good or Satisfactory condition and it forecasts that by 2018 bridges in these categories will be up to 89 percent. The target has two components. The first is to have 55 percent of the bridges in Good condition and at least 29 percent in Satisfactory condition. The second is to have substantially achieved the Chapter 152 goals of replacing or rehabilitating the 120 fracture-critical or structurally deficient bridges.
MnDOT's Statewide 20-year Highway Investment Plan 2009-2028 forecasts that for 2009-2019, it needs to spend $2.420 billion to meet the Chapter 152 requirements and $725 million to meet performance targets for the remaining State bridges. Those approximate amounts are forecast to be budgeted throughout the program period. As seen in Table 19, the sustainability ratios for the Minnesota bridges therefore are positive, indicating adequate investment over that period.
These sufficient levels of investment through 2018 are in contrast to those reported in the pavement section, Chapter 4, which indicated pavement investment budgets were only 72 percent of the level needed to sustain condition targets through 2018.
Figure 47: MnDOT long-term investment trends.
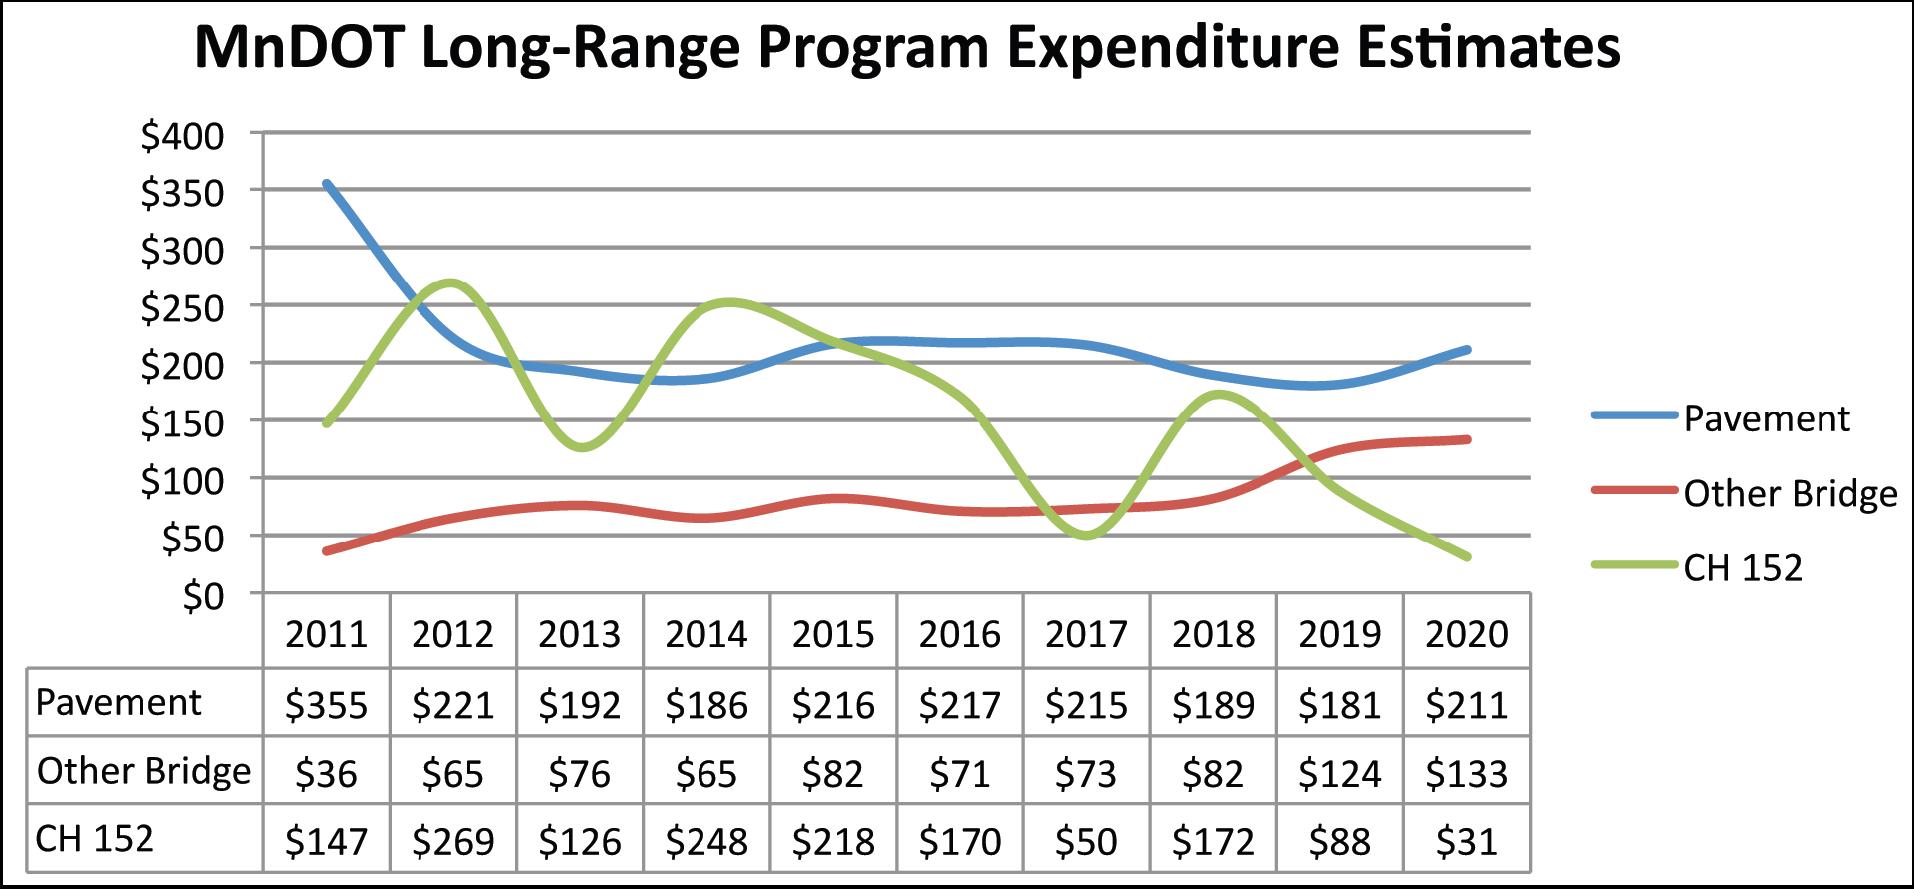
Although, MnDOT will have achieved its bridge condition targets through 2020, its reporting provides insight into even longer-term implications. As seen in Figure 47, the Chapter 152 bridge expenditures significantly exceed those of the regular bridge program. The Chapter 152 bond funds fluctuate through the years based upon when the large structures are ready for bid. The annual Chapter 152 expenditures decline through the period and end by approximately 2020. Although the Chapter 152 expenditures will address 120 large structures, those are a small percentage of the State's 3,898 structures over 20 feet in length. The 2010 bridge report includes the statistics from Figure 46 that show that while the Good and Poor Categories have improved, the "Fair" condition bridges have increased between 2006 and 2010.
As the bridge inventory ages, the "Fair" bridges will experience additional loadings, require additional repair, and some percentage of the Satisfactory bridges likewise will slide into the Fair or even Poor categories. These represent a long-term obligation for the department. The Statewide 20-Year Highway Investment Plan from 2009 indicates that predicted financial need from 2019-2028 to sustain the bridge condition targets jumps to $2.004 billion in the non-Chapter 152 structures. That $2.004 billion need number for the decade from 2019-2028 is 176 percent higher than the amount budgeted in the 2009-2018 decade for the non-Chapter 152 bridges. In effect, an amount approximate to the Chapter 152 program will be needed in the following decade just to sustain MnDOT's structures at targeted levels in the decade 2019-2028.
The amount to be available in the years 2019-2028 is highly uncertain. That period represents a fairly distant future in terms of legislative and appropriation cycles. However, MnDOT has made an estimate of available revenue predicated on an assumption of no new sources of revenue or rate increases. It estimates that approximately $6.530 billion will be available from 2019-2028.
MnDOT's recommended investment strategy with that revenue is to invest 84 percent of it into infrastructure preservation, 8 percent into safety improvements, 5 percent into mobility enhancements, 4 percent into regional and community improvement projects and 2 percent into related costs such as right of way and engineering. MnDOT articulated a clear hierarchy of priorities, with the following ranking:
This recommended investment strategy is subject to change from several events including a planned update to the Statewide 20-Year Highway Investment Plan.
These priorities led to MnDOT's recommendation to substantially increase investment in the non-Chapter 152 bridges in the 2019-2028 period to $1.820 billion, compared to approximately $780 million in the preceding decade. With that substantially increased investment in its bridge inventory, MnDOT predicts that it can create a sustainable bridge inventory through 2029. However, the same report also notes the decline in the State's pavement conditions on the non-principal arterials. MnDOT reports that a lack of sufficient revenue leads to the consequence of underfunding pavements on non-principal arterials in order to meet the bridge and safety targets, and to meet pavement targets on the principal arterials.
The long-term perspective provided by the MnDOT analysis allows policy makers to understand the approximate magnitude of long-term bridge needs. As the agency's bridges age, as construction prices rise and as loadings increase on the bridge inventory, the level of expenditure that today is seen as extraordinary to respond to the Chapter 152 requirements could become the norm just to sustain conditions.
Table 19 above showed that through the 2018 period, the department forecasted a Bridge Sustainability Index near the optimum of 1.0 for both the Chapter 152 bridges and the regular bridge inventory. MnDOT proposes a continued increased investment level in bridges beyond 2018 as it fulfills the Chapter 152 requirements, and shifts the investment focus to the State's remaining bridge inventory. If MnDOT's investment strategy for 2019-2028 comes to pass, the analysis indicates that MnDOT can provide the State a sustainable bridge inventory that continues to meet condition targets.
The type of analysis that MnDOT produces also allows creation of a Bridge Sustainability Ratio, providing another example of how a U.S. transportation agency could replicate the type of ratios that are used in policy analysis in Great Britain, Australia and elsewhere.
The North Carolina DOT (NCDOT) applies its bridge management system's forecasting capability to produce long-term scenarios of bridge needs that allow it to produce analyses very similar to a Bridge Sustainability Ratio. The department has reported that if current funding levels remain the same, bridge condition improvements of the past decade are likely to reverse. Additional long-term investments of up to 45 percent higher than past investment levels will be needed to sustain current bridge network conditions. The NCDOT sustainability ratio-like analyses depict both the magnitude and the cost of long-term investments to sustain bridge conditions.
The NCDOT notes that a comprehensive, sustainable infrastructure management approach provides the highest levels of conditions for the lowest cost over the lifecycle of its bridges. It uses a mix of treatments of maintenance, preservation, rehabilitation, and replacement. Its budgeting process primarily relies on State funds for programming its maintenance and preservation programs and Federal Highway Bridge Program (HBP) funds for rehabilitation and replacement. The Department has recently executed an agreement with FHWA for an Interstate Preservation Program for pavements, bridges and other roadway assets using Federal Interstate Maintenance funds to proactively improve performance on that network.
The NCDOT structures data come from the federally required biennial bridge inspections, as well as from the inspection of pipes and culverts. These address not only the bridges over 20 feet in length that qualify as a federally recognized bridge but they also apply to pipes and culverts.
NCDOT divides its State funded bridge structure and maintenance work into two categories of programs, Recurring and Performance-Based Programs. Recurring programs include drawbridge maintenance, small bridge replacements, large culvert installation and maintenance and scour/slope replacements.
Its Performance Based activities include the maintenance and repair of many bridge elements. A detailed analysis of those items is conducted through the Bridge Condition Survey. The inspections assess the condition of the State system highway bridges for five major elements, railings, decks, expansion joints, superstructure, and substructure. As each bridge is inspected every two years, survey teams assess the condition of the elements for each bridge. Element conditions are determined for each bridge and summarized into a statewide Bridge Condition Rating. In addition, the survey teams determine the quantity and type of repair needed. These inspections and assessments then are used to calculate the statewide bridge maintenance needs. The process also provides the level of service for decks, superstructures, substructure, rails and expansion joints and produces an estimated annual cost to maintain these elements at the targeted levels.
The Recurring and Performance-Based Programs both complement the NCDOT's policy of sustaining acceptable condition targets for the lowest-lifecycle costs. The Recurring funds "come off the top" either because their activities are legally mandated or because they are known to contribute to sound long-term maintenance of structures. These would include bridge inspection, drawbridge maintenance, culvert maintenance, debris removal around piers, slip protection, approach slab maintenance and other activities as shown in Table 20. Table 20 also illustrates the significant degree of granularity that the NCDOT analysis provides for agency executives, external policy makers or the public. It breaks down Recurring expenditures in 11 categories, all which relate to key infrastructure activities necessary to sustain its bridges.
| 2011-12 | 2012-13 | 2013-14 | 2014-15 | 2015-16 | 2016-17 | 2017-18 | ||
|---|---|---|---|---|---|---|---|---|
| Recurring Bridge Activities | ||||||||
| Culverts | $2.35 | $2.45 | $2.55 | $2.66 | $2.77 | $2.89 | $3.01 | |
| Clearing & Slp Prot. | $1.72 | $1.79 | $1.87 | $1.95 | $2.03 | $2.11 | $2.20 | |
| Drawbridges | $2.79 | $2.91 | $3.03 | $3.16 | $3.29 | $3.43 | $3.57 | |
| Bridge Repl. | $6.29 | $6.55 | $6.83 | $7.12 | $7.42 | $7.73 | $8.05 | |
| Bridge Inspect. | $2.37 | $2.47 | $2.57 | $2.68 | $2.79 | $2.91 | $3.03 | |
| Approach Slabs/Surfacing | $0.24 | $0.25 | $0.26 | $0.27 | $0.28 | $0.29 | $0.31 | |
| Drift and Debris Removal | $1.81 | $1.89 | $1.97 | $2.05 | $2.13 | $2.22 | $2.32 | |
| Small Pipe Maint & Repl't | $6.15 | $6.41 | $6.68 | $6.96 | $7.25 | $7.55 | $7.87 | |
| Walls and Tunnels | $0.22 | $0.23 | $0.24 | $0.25 | $0.26 | $0.27 | $0.28 | |
| Walkways | $0.13 | $0.14 | $0.14 | $0.15 | $0.15 | $0.16 | $0.17 | |
| Bridge Fender Systems | $3.00 | $1.00 | $1.00 | $1.00 | $1.00 | $1.00 | $1.00 | |
| Total | $27.07 | $26.08 | $27.13 | $28.23 | $29.38 | $30.57 | $31.81 | |
| (in $millions) | ||||||||
Table 21 includes the maintenance programs for Performance Based categories. Again, significant granularity is provided which allows for insightful analysis and tradeoff decisions.
| 2011-12 | 2012-13 | 2013-14 | 2014-15 | 2015-16 | 2016-17 | 2017-18 | ||
|---|---|---|---|---|---|---|---|---|
| Performance Based Activities | ||||||||
| Railings | $1.44 | $1.50 | $1.56 | $1.63 | $1.70 | $1.77 | $1.84 | |
| Bridge Decks | $13.04 | $13.59 | $14.16 | $14.75 | $15.37 | $16.02 | $16.69 | |
| Expansion Joints | $4.85 | $5.05 | $5.27 | $5.49 | $5.72 | $5.96 | $6.21 | |
| Superstructures | $11.62 | $12.11 | $12.62 | $13.15 | $13.70 | $14.27 | $14.87 | |
| Substructure | $13.63 | $14.20 | $14.80 | $15.42 | $16.07 | $16.74 | $17.45 | |
| Total | $44.58 | $46.45 | $48.40 | $50.44 | $52.55 | $54.76 | $57.06 | |
The detail provided by the bridge investment analysis shown in Tables 20 and 21 illustrate that a Bridge Sustainability Ratio could be produced for each category of expenditure. What is not known at this time, is what the budget amounts will be for each category through 2017-2018. Those amounts have not been appropriated. However, the type of mature bridge management analysis produced by the NCDOT illustrates that a Bridge Sustainability Ratio could be forecast not only for the total bridge inventory but also for various categories as shown in Tables 20 and 21.
Two other categories of expenditures are components of the department's lifecycle approach to its bridge management. The first category is an active Bridge Preservation Program that consists of minor, low-cost treatments performed on bridges that are in relatively good condition. These activities include painting structural steel, cleaning bearings, repairing and replacing expansion joints, applying materials to slow corrosion, waterproofing or resurfacing decks. The other category is Bridge Rehabilitation, which includes treatments to restore bridge components to "like new" conditions. Rehabilitation is cost effective when some portions of a bridge are in good to fair condition but other components are in poor condition. The poor condition components can be rehabilitated without having to replace the entire bridge.
If a bridge is deteriorated to the point that it is not economical to bring it to acceptable condition through preservation, maintenance or rehabilitation, it becomes a candidate for replacement. Those structures are matriculated to the replacement program and are funded through the capital programs, largely funded through the Statewide Transportation Improvement Program (STIP).
| Bridge Conditions | Interstate | Primary | Secondary | Statewide | |||||
|---|---|---|---|---|---|---|---|---|---|
| 2010 | State Average | 2010 | State Average | 2010 | State Average | Average | |||
| Element | Performance Measures | Target | Score | Target | Score | Target | Score | ||
| Bridge Deck | Concrete | % of decks rated greater than or equal to 6 | 85 | 85 | 80 | 79 | 75 | 84 | 82 |
| Timber | 85 | NA | 80 | 86 | 75 | 88 | 88 | ||
| Steel Planks | 85 | NA | 80 | 71 | 75 | 84 | 84 | ||
| Open Grid Steel | 85 | NA | 80 | 50 | 75 | 33 | 47 | ||
| Superstructure | Concrete | % of superstructure rated greater than or equal to 6 | 90 | 81 | 85 | 60 | 80 | 65 | 62 |
| Steel | 90 | 89 | 85 | 82 | 80 | 81 | 82 | ||
| P/S Concrete | 90 | 96 | 85 | 95 | 80 | 94 | 94 | ||
| Timber | 90 | NA | 85 | 43 | 80 | 69 | 68 | ||
| Substructure | Timber | % of substructure rated greater than or equal to 6 | 90 | NA | 85 | 40 | 80 | 42 | 42 |
| Concrete Pile | 90 | 80 | 85 | 75 | 80 | 81 | 77 | ||
| Steel Pile | 90 | 91 | 85 | 84 | 80 | 81 | 82 | ||
| Concrete Piers | 90 | 91 | 85 | 81 | 80 | 82 | 82 | ||
| Other | NBIS Culverts | Condition Rating >=6 | 85 | 86 | 85 | 86 | 85 | 89 | 87 |
| Non-NBIS Culverts | Condition Rating = Good | 80 | 84 | 80 | 74 | 80 | 56 | 71 | |
| Overhead Sign Structures | Condition Rating = Good | 95 | 95 | 95 | 93 | 95 | 88 | 92 | |
Table 22 illustrates two significant aspects of the NCDOT process for managing its bridges. First, the table illustrates the tradeoffs inherent in the setting of condition targets. The targets for the high-volume Interstate Highway System are consistently higher than for the Primary or the Secondary system. Also, the targets are more frequently obtained on the Interstate Highway System than on other two networks. The DOT in recent years has increased its investment emphasis on the Interstate Highway System as part of its performance-based approach to asset management. Since the State is responsible for most of the public road system, local divisions and staff work closely with local communities and residents on the local routes. That has created a long-standing focus on local routes. In recent years as the department shifted to a more data-driven, asset management-based approach, it has set higher standards and directed more resources to the higher-volume Interstate Highway System. This was driven in part by the adoption of a Statewide, Long-Range Multimodal Transportation Plan in 2004 that broke the highway network into three distinct tiers, Statewide (Interstate/NHS), Regional ( NC/Lower importance U.S.) and Sub-regional (secondary and municipal routes) based on their function and level of importance.
In 2008 the NCDOT developed and implemented a Bridge Health Index (BHI) as a means of providing a composite evaluation of its bridge conditions and to use in conjunction with the companion performance metrics and targets. Originally, the BHI was based on a composite score of 18 or higher using the 0-9 NBI ratings for Deck, Superstructure and Substructure with the caveat that none of these components could be rated below a "6". Bridge Performance metrics were developed using a similar approach to that employed for pavements based on percent "Good." Performance Targets were established for each of the previously discussed network tiers. The NCDOT has since modified its BHI to incorporate a factor for weight restrictions in addition to the component conditions such that the average of all four factors must be a "6" or higher for a bridge to be considered in "good" condition. The performance targets are outlined above in Table 22 for the network. It should also be noted that the NCDOT is now in the process of converting NBI condition values to the new AASHTO Condition States.
The mature management systems that the NCDOT use allow it to conduct optimized tradeoff analyses between its pavement, bridge and maintenance programs. It has run the scenarios as part of its planning and programming process. To date, however, the computerized optimization analyses between asset classes have not been a determinant in final decisions of how much to invest in the different asset classes. It remains one of several factors including department policy, input from the Board of Transportation, engineering judgment and other factors.
The data-driven NCDOT bridge process also allows for significant transparency in reporting to the Board of Transportation, the Legislature and to the public. As seen in Table 22, six of 10 of the bridge condition targets on the Interstate Highway System were met, with four other categories falling just short of target for a "yellow" rating. On the Primary system, only two of 12 categories met their target, another six were close for a "yellow" score and four were significantly below target for a "red" score. On the Secondary system, nine categories met their target, one was just below for a "yellow" rating and five were significantly below for a "red" rating.
These types of more detailed measures are reported in the annual Maintenance Condition and Assessment (MCAP) Report presented to the Legislature. The same type of data is compiled into a simpler dashboard set of performance metrics tracked continuously on the DOT website. For the website metrics, the Department consolidates the bridge, pavement and maintenance condition data into an Infrastructure Health Index that is comprised of a health index for each category.
The Bridge Health Index has reported the following scores over time as shown in Figure 48.
Figure 48: North Carolina network-wide bridge health conditions.
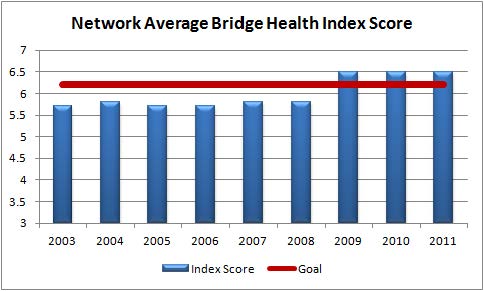
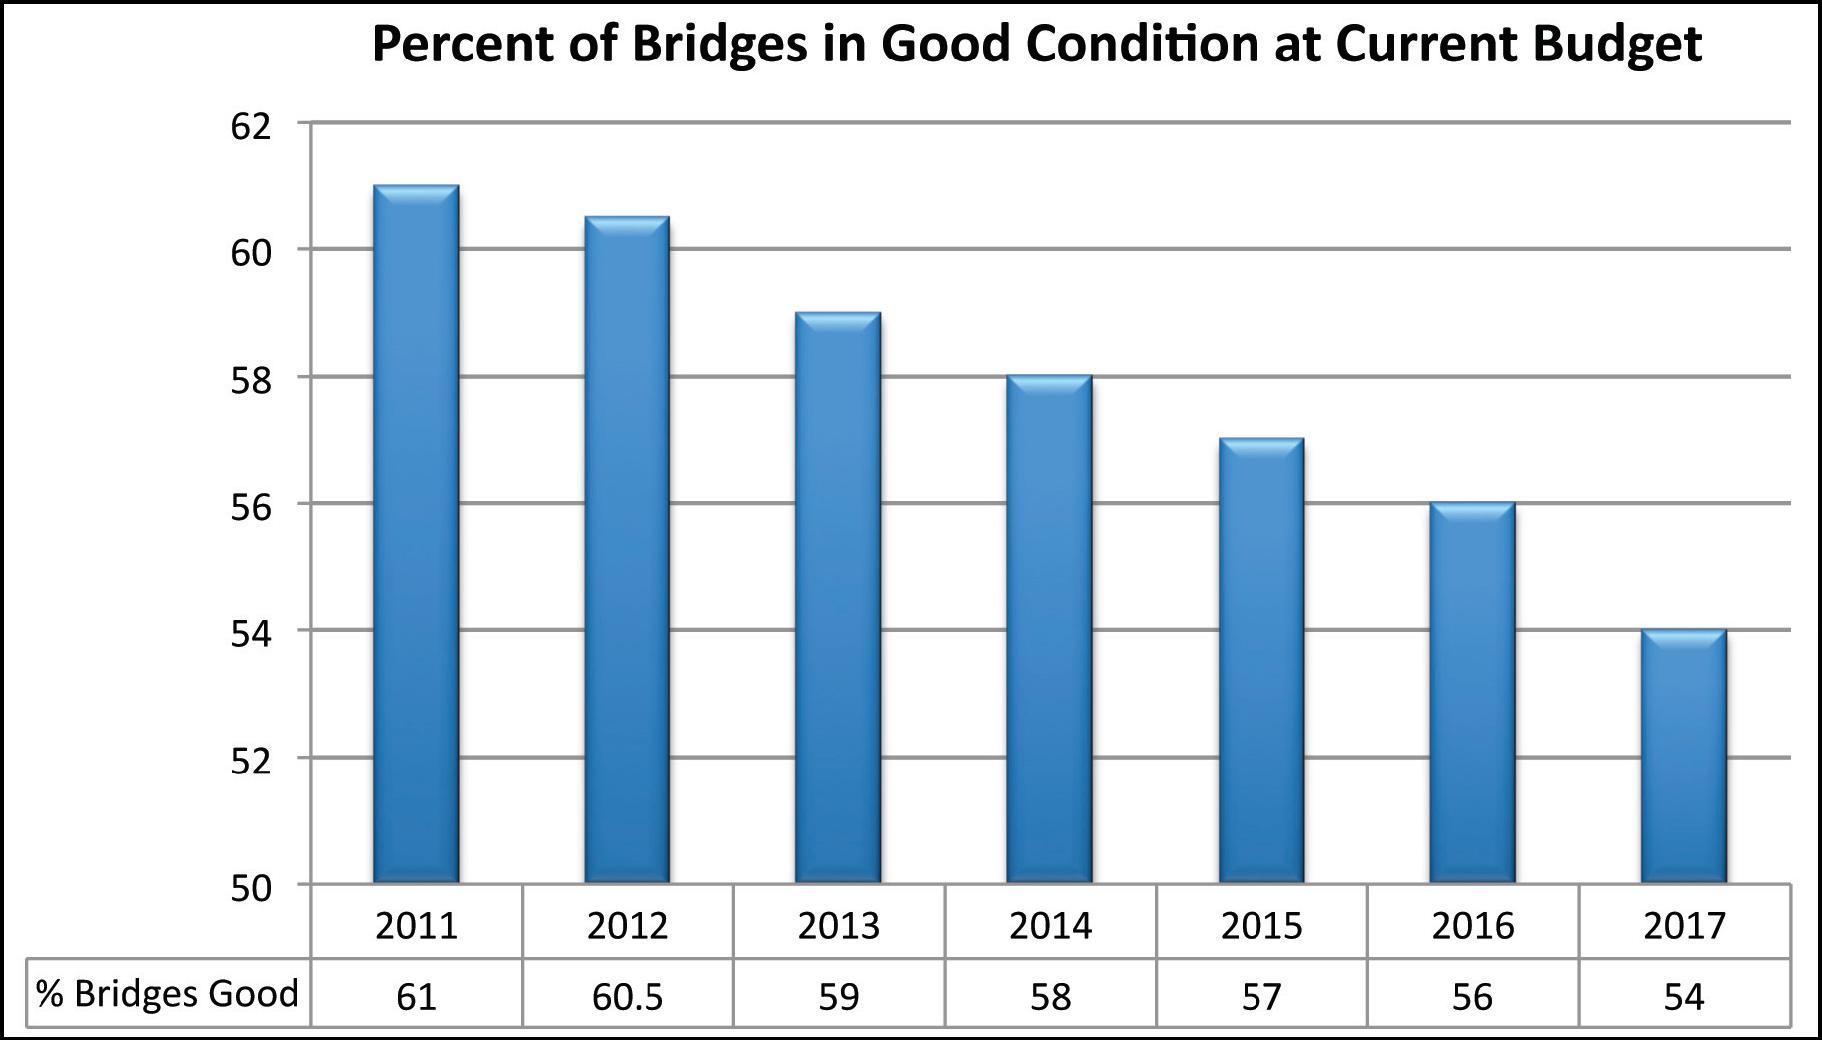
Although the department's network-wide Bridge Health conditions have improved as shown in Figure 48, it warns that if bridge investment levels do not increase, that these positive trends will reverse. The Department reports that higher material prices, increases in traffic, and expansion of the highway network necessitate higher investments to sustain these conditions over the next decade. Its management systems forecast that if expenditure levels remain at current levels, the percentage of bridges in "good" condition is projected to decline from 62 percent in 2011 to approximately 54 percent by 2017 as seen in Figure 49.
Figure 49: Forecasted decline in bridge health at current expenditure levels.
Using its management system forecasting capability, the department estimates that between 2012 and 2021, bridge investments will need to total $3.918 billion, compared to the $2.169 billion spent in the preceding 10 years. These numbers allow the depiction of Bridge Sustainability Ratios to be illustrated based upon different spending scenarios. If the expenditures are flat, the Bridge Sustainability Ratio for the next decade would be only .55. That is based on:
| Budget Need |
$2.169 billion $3.918 billion |
However, the department has drafted tentative long-term bridge allocations shown in Table 23.
| (Federal HBP and IM for All Systems- Interstate, Primary, Secondary) | ||||||||||
| Activity | 2012 | 2013 | 2014 | 2015 | 2016 | 2017 | 2018 | 2019 | 2020 | 2021* |
|---|---|---|---|---|---|---|---|---|---|---|
| Preservation | $45 | $45 | $45 | $50 | $50 | $50 | $50 | $50 | $50 | $50 |
| Rehabilitation | $0 | $0 | $0 | $25 | $25 | $25 | $25 | $25 | $25 | $25 |
| Replacement | $191 | $155 | $95 | $154 | $179 | $204 | $229 | $254 | $254 | $254 |
| Total HBP & IM Sys. Pres | $236 | $200 | $140 | $229 | $254 | $279 | $304 | $329 | $329 | $329 | NCDOT Projected State Funding for Bridge Program (Primary& Secondary) |
| Preservation | $15 | $15 | $15 | $15 | $15 | $15 | $15 | $15 | $15 | $15 |
| Maintenance and Repair incl. Elec. Sys. | $59 | $59 | $59 | $59 | $59 | $59 | $59 | $59 | $59 | $59 |
| Rehab-Non Recurring | $225 | $225 | $0 | $0 | $0 | $0 | $0 | $0 | $0 | $0 |
| Replacement of small bridges | $12 | $12 | $12 | $12 | $12 | $12 | $12 | $12 | $12 | $12 |
| Total State Maint & Pres | $311 | $321 | $86 | $86 | $86 | $86 | $86 | $86 | $86 | $86 | Total Bridge Program- All Systems and Funding Sources |
| Maintenance | $59 | $59 | $59 | $59 | $59 | $59 | $59 | $59 | $59 | $59 |
| Preservation | $60 | $60 | $60 | $65 | $65 | $65 | $65 | $65 | $65 | $65 |
| Rehabilitation | $225 | $235 | $0 | $25 | $25 | $25 | $25 | $25 | $25 | $25 |
| Replacement | $203 | $167 | $107 | $166 | $191 | $216 | $241 | $266 | $266 | $266 |
| Total All Funds | $547 | $521 | $226 | $315 | $340 | $365 | $390 | $415 | $415 | $415 | *2021 estimate unavailable. Assumes same as 2020. |
The higher expenditures assumed for Table 23 would generate just over $3.9 billion over the next decade, which would increase the Bridge Sustainability Ratio to just over 1.0 at 1.007. The two scenarios illustrate for policy makers the magnitude of the investment necessary to sustain the department's bridge inventory at its current levels.
As stated in the opening chapter, the intent of this report is to illustrate the proof of concept of the sustainability ratios and to illustrate how they can provide policy makers with enhanced understanding of the needed levels of investment required to sustain the highway system into the future. Although, the North Carolina budget categories and asset class definitions vary considerably from the other case study States in this report, its extensive asset management systems and sophisticated budgeting process provide the data to produce bridge sustainability ratios that are germane to North Carolina policy makers. Current investment levels are near the optimum 1.0 for the Bridge Sustainability Ratio but that will need to increase in the next decade by more than 40 percent above than the average invested in each year of the past decade. Such analysis allows policy makers to understand not only how the physical conditions of the highway system are likely to change, but also how to calibrate the levels of investment necessary to sustain conditions indefinitely.
| << Previous | Contents | Next >> |